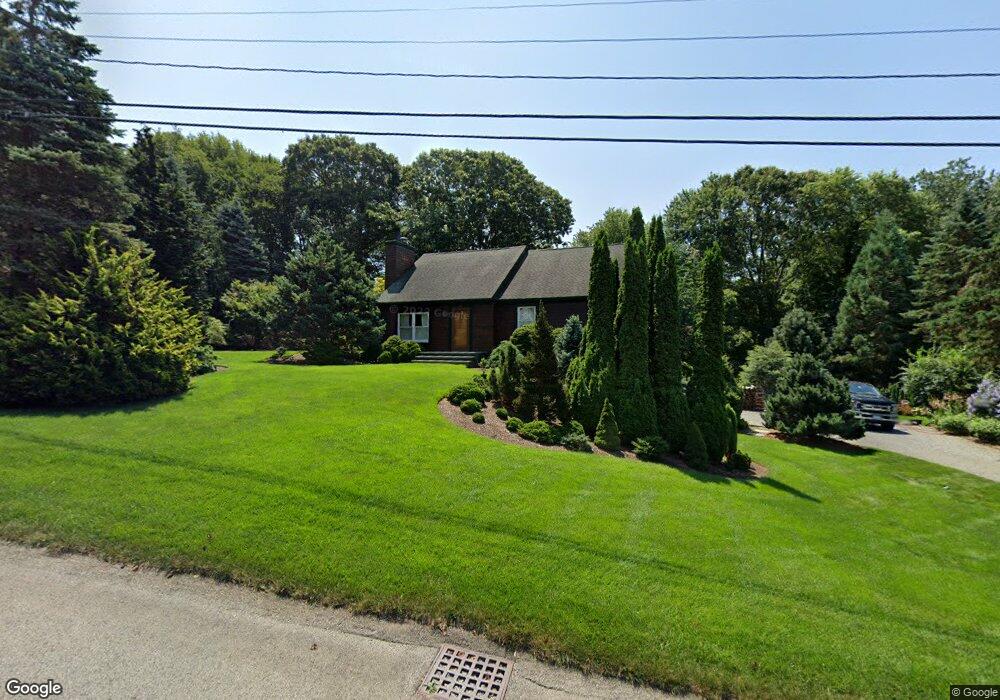
141 Sloop St Jamestown, RI 02835
West Reach Estates NeighborhoodEstimated Value: $765,000 - $796,000
3
Beds
1
Bath
1,160
Sq Ft
$675/Sq Ft
Est. Value
About This Home
This home is located at 141 Sloop St, Jamestown, RI 02835 and is currently estimated at $782,569, approximately $674 per square foot. 141 Sloop St is a home located in Newport County with nearby schools including Melrose Avenue School and Lawn Avenue School.
Ownership History
Date
Name
Owned For
Owner Type
Purchase Details
Closed on
Dec 14, 2001
Sold by
Birdsall Daniel S and Birdsall Anne Marie
Bought by
Hunter Andrew O and Feeney Courtney
Current Estimated Value
Purchase Details
Closed on
Feb 19, 1999
Sold by
Chagnon John H and Chagnon Pamela
Bought by
Birdsall Daniel Shaw
Create a Home Valuation Report for This Property
The Home Valuation Report is an in-depth analysis detailing your home's value as well as a comparison with similar homes in the area
Home Values in the Area
Average Home Value in this Area
Purchase History
| Date | Buyer | Sale Price | Title Company |
|---|---|---|---|
| Hunter Andrew O | $199,000 | -- | |
| Birdsall Daniel Shaw | $156,000 | -- |
Source: Public Records
Mortgage History
| Date | Status | Borrower | Loan Amount |
|---|---|---|---|
| Open | Birdsall Daniel Shaw | $295,500 | |
| Closed | Birdsall Daniel Shaw | $100,000 | |
| Closed | Birdsall Daniel Shaw | $220,500 |
Source: Public Records
Tax History
| Year | Tax Paid | Tax Assessment Tax Assessment Total Assessment is a certain percentage of the fair market value that is determined by local assessors to be the total taxable value of land and additions on the property. | Land | Improvement |
|---|---|---|---|---|
| 2025 | $3,830 | $679,100 | $283,400 | $395,700 |
| 2024 | $3,850 | $536,900 | $214,700 | $322,200 |
| 2023 | $3,817 | $546,800 | $214,700 | $332,100 |
| 2022 | $3,713 | $546,800 | $214,700 | $332,100 |
| 2021 | $3,125 | $377,400 | $198,100 | $179,300 |
| 2020 | $3,029 | $375,400 | $198,100 | $177,300 |
| 2019 | $3,022 | $375,400 | $198,100 | $177,300 |
| 2018 | $3,038 | $343,300 | $179,300 | $164,000 |
| 2017 | $2,973 | $343,300 | $179,300 | $164,000 |
| 2016 | $2,946 | $343,300 | $179,300 | $164,000 |
| 2015 | $2,851 | $324,700 | $209,700 | $115,000 |
| 2014 | $2,841 | $324,700 | $209,700 | $115,000 |
Source: Public Records
Map
Nearby Homes
- 400 Schooner Ave
- 86 Spanker St
- 777 E Shore Rd
- 174 Seaside Dr
- 121 Seaside Dr
- 44 Mast St
- 0 Circuit Ave
- 10 Coulter St
- 31 Buloid Ave
- 83 Oceanwoods Dr
- 127 Longfellow Rd
- 63 Longfellow Rd
- 46 North Rd
- 30 W Bay View Dr
- 73 Conanicus Ave Unit 4
- 78 Narragansett Ave
- 77 Narragansett Ave Unit C
- 14 Clinton Ave
- 480 Boston Neck Rd
- 22 Cole St
Your Personal Tour Guide
Ask me questions while you tour the home.