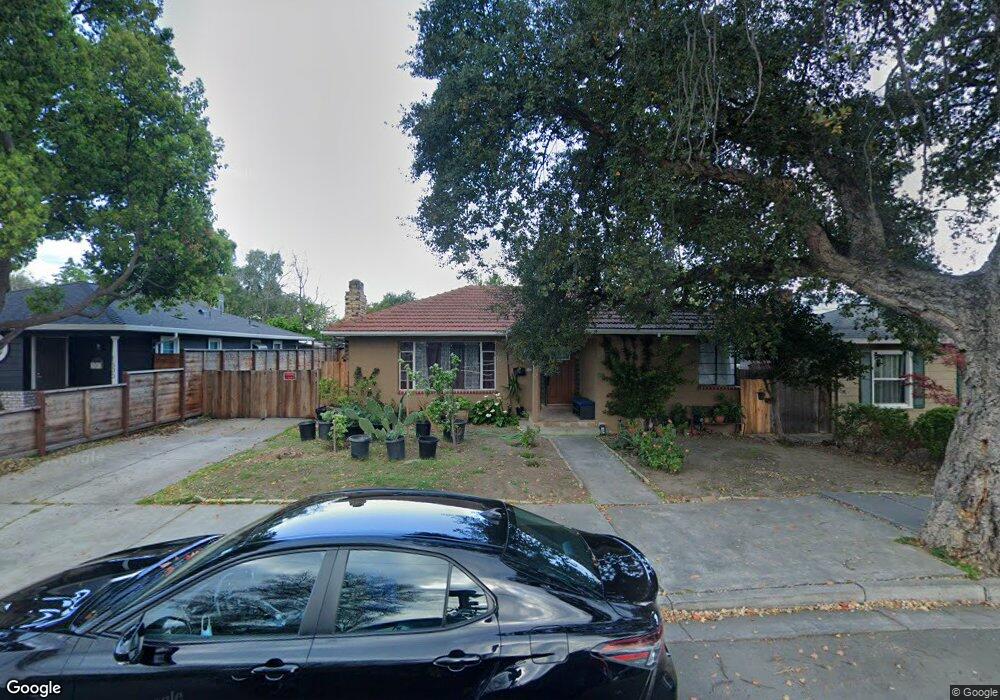
1410 C St Antioch, CA 94509
North Antioch NeighborhoodEstimated Value: $443,000 - $520,000
3
Beds
2
Baths
1,317
Sq Ft
$363/Sq Ft
Est. Value
About This Home
This home is located at 1410 C St, Antioch, CA 94509 and is currently estimated at $478,274, approximately $363 per square foot. 1410 C St is a home located in Contra Costa County with nearby schools including Fremont Elementary School, Antioch Middle School, and Antioch High School.
Ownership History
Date
Name
Owned For
Owner Type
Purchase Details
Closed on
Sep 23, 2003
Sold by
Oneil Richard Patrick and Onei Leslie
Bought by
Munguia Armando
Current Estimated Value
Home Financials for this Owner
Home Financials are based on the most recent Mortgage that was taken out on this home.
Original Mortgage
$216,000
Outstanding Balance
$105,336
Interest Rate
6.99%
Mortgage Type
Purchase Money Mortgage
Estimated Equity
$372,938
Purchase Details
Closed on
Mar 16, 2001
Sold by
Oneil and Leslie
Bought by
Oneil Richard Patrick and Oneil Leslie Joan
Purchase Details
Closed on
Feb 25, 2000
Sold by
Padilla Angelo J
Bought by
Oneil Richard and Oneil Leslie
Home Financials for this Owner
Home Financials are based on the most recent Mortgage that was taken out on this home.
Original Mortgage
$118,037
Interest Rate
8.26%
Mortgage Type
Purchase Money Mortgage
Create a Home Valuation Report for This Property
The Home Valuation Report is an in-depth analysis detailing your home's value as well as a comparison with similar homes in the area
Home Values in the Area
Average Home Value in this Area
Purchase History
| Date | Buyer | Sale Price | Title Company |
|---|---|---|---|
| Munguia Armando | $270,000 | First American Title | |
| Munguia Armando | -- | First American Title | |
| Oneil Richard Patrick | -- | -- | |
| Oneil Richard | $124,500 | Old Republic Title Company |
Source: Public Records
Mortgage History
| Date | Status | Borrower | Loan Amount |
|---|---|---|---|
| Open | Munguia Armando | $216,000 | |
| Previous Owner | Oneil Richard | $118,037 |
Source: Public Records
Tax History
| Year | Tax Paid | Tax Assessment Tax Assessment Total Assessment is a certain percentage of the fair market value that is determined by local assessors to be the total taxable value of land and additions on the property. | Land | Improvement |
|---|---|---|---|---|
| 2025 | $4,869 | $383,866 | $213,261 | $170,605 |
| 2024 | $4,626 | $376,340 | $209,080 | $167,260 |
| 2023 | $4,626 | $368,962 | $204,981 | $163,981 |
| 2022 | $4,555 | $361,728 | $200,962 | $160,766 |
| 2021 | $4,376 | $354,636 | $197,022 | $157,614 |
| 2019 | $4,327 | $344,119 | $191,179 | $152,940 |
| 2018 | $3,906 | $313,000 | $173,890 | $139,110 |
| 2017 | $3,567 | $285,000 | $158,335 | $126,665 |
| 2016 | $3,149 | $249,000 | $138,334 | $110,666 |
| 2015 | $2,908 | $226,500 | $125,834 | $100,666 |
| 2014 | $2,296 | $175,000 | $97,223 | $77,777 |
Source: Public Records
Map
Nearby Homes
Your Personal Tour Guide
Ask me questions while you tour the home.