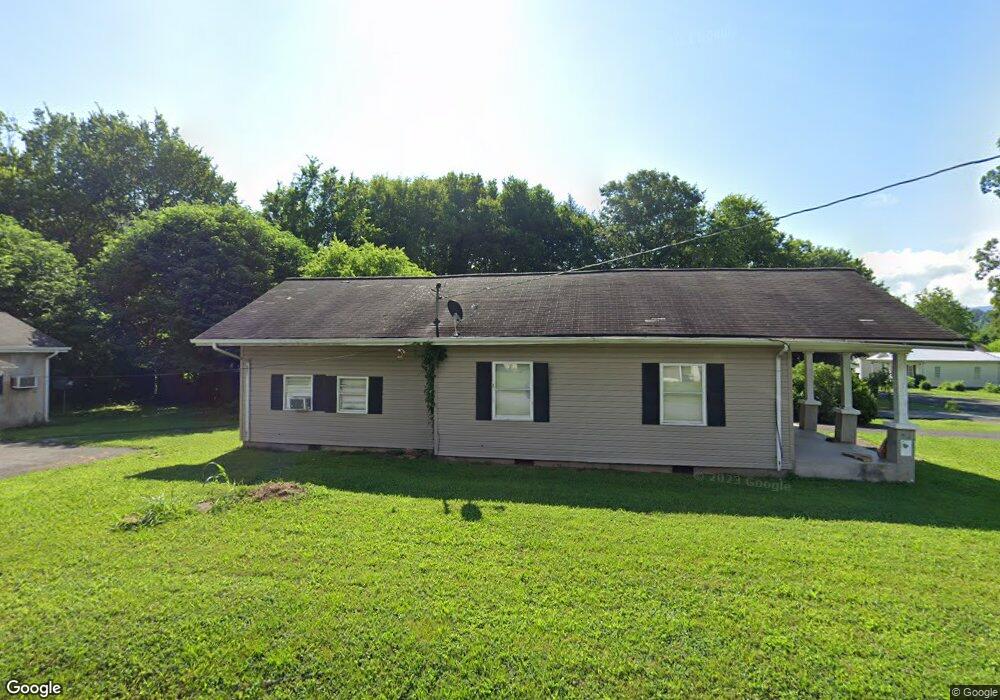
1410 Elm St Dunlap, TN 37327
Estimated Value: $172,000 - $238,000
5
Beds
2
Baths
1,580
Sq Ft
$121/Sq Ft
Est. Value
About This Home
This home is located at 1410 Elm St, Dunlap, TN 37327 and is currently estimated at $191,634, approximately $121 per square foot. 1410 Elm St is a home located in Sequatchie County with nearby schools including Griffith Elementary School, Sequatchie County Middle School, and Sequatchie County High School.
Ownership History
Date
Name
Owned For
Owner Type
Purchase Details
Closed on
Sep 24, 2014
Sold by
Metzger Christie
Bought by
Montes Manuel and Montes Maria L
Current Estimated Value
Purchase Details
Closed on
Jun 11, 2012
Sold by
Metzger Steven
Bought by
Metzger Christie
Purchase Details
Closed on
Dec 1, 2011
Sold by
Metzger Steven
Bought by
Bryant Dale and Bryant Lisa
Purchase Details
Closed on
Feb 19, 2008
Sold by
Battaglia Karia A
Bought by
Steven Metzger
Home Financials for this Owner
Home Financials are based on the most recent Mortgage that was taken out on this home.
Original Mortgage
$46,325
Interest Rate
5.46%
Purchase Details
Closed on
Jun 22, 2007
Sold by
Carmical Bobby L
Bought by
Battaglia Kari A
Purchase Details
Closed on
Sep 16, 2005
Bought by
Carmical Bobby L
Purchase Details
Closed on
Nov 6, 1999
Sold by
Thomas Harmon Ben and Thomas Wife
Bought by
Freeman J W J and Freeman Electa
Purchase Details
Closed on
Oct 25, 1993
Bought by
Harmon Ben Thomas and Wife Norma Maxine
Create a Home Valuation Report for This Property
The Home Valuation Report is an in-depth analysis detailing your home's value as well as a comparison with similar homes in the area
Home Values in the Area
Average Home Value in this Area
Purchase History
| Date | Buyer | Sale Price | Title Company |
|---|---|---|---|
| Montes Manuel | $40,000 | -- | |
| Metzger Christie | -- | -- | |
| Metzger Christie | -- | -- | |
| Bryant Dale | $1,000 | -- | |
| Steven Metzger | $54,500 | -- | |
| Battaglia Kari A | $47,000 | -- | |
| Carmical Bobby L | $332,400 | -- | |
| Freeman J W J | $80,000 | -- | |
| Harmon Ben Thomas | $30,000 | -- |
Source: Public Records
Mortgage History
| Date | Status | Borrower | Loan Amount |
|---|---|---|---|
| Previous Owner | Harmon Ben Thomas | $46,325 |
Source: Public Records
Tax History
| Year | Tax Paid | Tax Assessment Tax Assessment Total Assessment is a certain percentage of the fair market value that is determined by local assessors to be the total taxable value of land and additions on the property. | Land | Improvement |
|---|---|---|---|---|
| 2025 | $722 | $29,875 | $3,125 | $26,750 |
| 2024 | $722 | $29,875 | $3,125 | $26,750 |
| 2023 | $722 | $29,875 | $3,125 | $26,750 |
| 2022 | $487 | $14,675 | $2,350 | $12,325 |
| 2021 | $479 | $14,675 | $2,350 | $12,325 |
| 2020 | $479 | $14,675 | $2,350 | $12,325 |
| 2019 | $479 | $14,675 | $2,350 | $12,325 |
| 2018 | $474 | $14,675 | $2,350 | $12,325 |
| 2017 | $468 | $14,675 | $2,350 | $12,325 |
| 2016 | $473 | $14,225 | $2,350 | $11,875 |
| 2015 | $474 | $14,225 | $2,350 | $11,875 |
| 2014 | $474 | $14,225 | $2,350 | $11,875 |
Source: Public Records
Map
Nearby Homes
- 410 Cherry St
- 159 Poplar St
- 95 Blue Sky Rd Rd
- 254 Cdl Trail
- 0 Jericho Rd Unit 1523837
- 0 Jericho Rd Unit RTC3043766
- 0 Jericho Lot 14 Rd
- 0 State Rt 399 Lot 13
- 0 SE US Hwy 127 Unit 1519993
- 0 SE US Hwy 127 Unit 1519990
- 0 SE US Hwy 127 Unit 1519988
- 0 SE US Hwy 127 Unit 1314389
- 0 SE US Hwy 127 Unit 1519979
- 0 SE US Hwy 127 Unit 1519991
- 0 SE US Hwy 127 Unit 1519984
- 21550 U S 127
- 21552 U S 127
- 1 Fredonia Rd
- 3 Fredonia Rd
- 2 Fredonia Rd