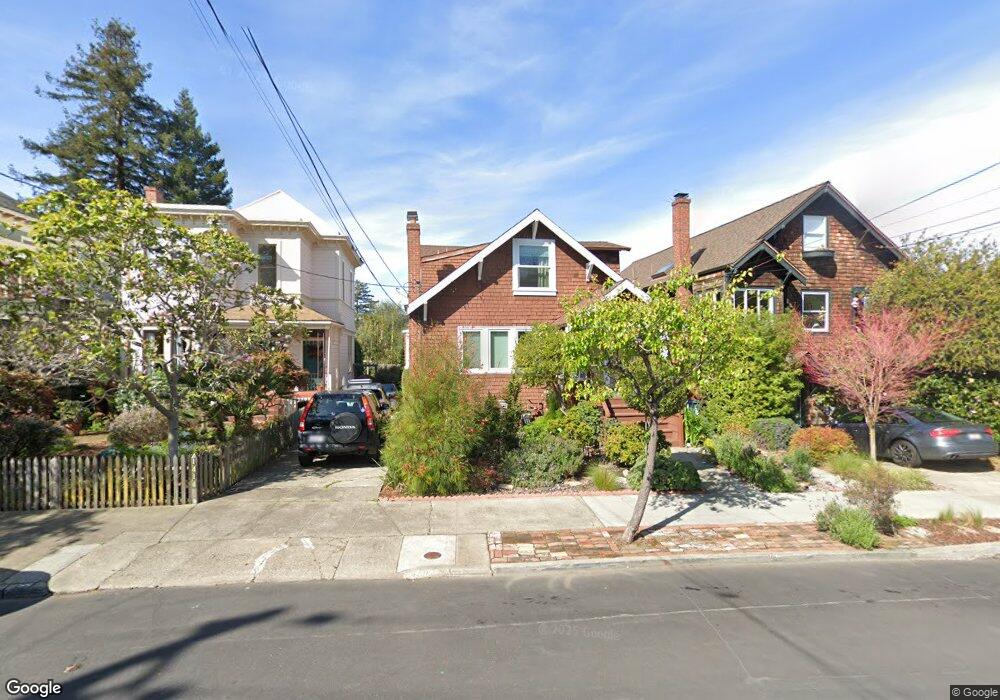
1410 Milvia St Berkeley, CA 94709
North Berkeley NeighborhoodEstimated Value: $1,388,000 - $1,696,000
1
Bed
1
Bath
862
Sq Ft
$1,795/Sq Ft
Est. Value
About This Home
This home is located at 1410 Milvia St, Berkeley, CA 94709 and is currently estimated at $1,547,285, approximately $1,794 per square foot. 1410 Milvia St is a home located in Alameda County with nearby schools including Berkeley Arts Magnet at Whittier School, Washington Elementary School, and Cragmont Elementary School.
Ownership History
Date
Name
Owned For
Owner Type
Purchase Details
Closed on
Sep 29, 2015
Sold by
Khouri Rima
Bought by
Khouri Rima and Rima Khouri Trust
Current Estimated Value
Purchase Details
Closed on
Oct 9, 2014
Sold by
Khouri Nader P and Khouri Rima
Bought by
Khouri Nader P and Khouri Rima
Purchase Details
Closed on
Dec 13, 2005
Sold by
Nassir Maher
Bought by
Khouri Nader P and Khouri Rima
Home Financials for this Owner
Home Financials are based on the most recent Mortgage that was taken out on this home.
Original Mortgage
$650,000
Interest Rate
1%
Mortgage Type
Negative Amortization
Purchase Details
Closed on
May 19, 2005
Sold by
Spragan Johnathan and Estate Of Myrsam H Wixman
Bought by
Nassir Maher
Home Financials for this Owner
Home Financials are based on the most recent Mortgage that was taken out on this home.
Original Mortgage
$575,680
Interest Rate
6.37%
Mortgage Type
Purchase Money Mortgage
Create a Home Valuation Report for This Property
The Home Valuation Report is an in-depth analysis detailing your home's value as well as a comparison with similar homes in the area
Home Values in the Area
Average Home Value in this Area
Purchase History
| Date | Buyer | Sale Price | Title Company |
|---|---|---|---|
| Khouri Rima | -- | None Available | |
| Khouri Nader P | -- | None Available | |
| Khouri Nader P | $814,000 | Chicago Title Company | |
| Nassir Maher | $720,000 | Chicago Title Co |
Source: Public Records
Mortgage History
| Date | Status | Borrower | Loan Amount |
|---|---|---|---|
| Previous Owner | Khouri Nader P | $650,000 | |
| Previous Owner | Nassir Maher | $575,680 | |
| Closed | Nassir Maher | $143,920 |
Source: Public Records
Tax History
| Year | Tax Paid | Tax Assessment Tax Assessment Total Assessment is a certain percentage of the fair market value that is determined by local assessors to be the total taxable value of land and additions on the property. | Land | Improvement |
|---|---|---|---|---|
| 2025 | $16,347 | $1,105,297 | $333,689 | $778,608 |
| 2024 | $16,347 | $1,083,490 | $327,147 | $763,343 |
| 2023 | $16,014 | $1,069,115 | $320,734 | $748,381 |
| 2022 | $15,742 | $1,041,154 | $314,446 | $733,708 |
| 2021 | $15,788 | $1,020,608 | $308,282 | $719,326 |
| 2020 | $14,979 | $1,017,076 | $305,123 | $711,953 |
| 2019 | $14,431 | $997,141 | $299,142 | $697,999 |
| 2018 | $14,200 | $977,597 | $293,279 | $684,318 |
| 2017 | $13,707 | $958,435 | $287,530 | $670,905 |
| 2016 | $13,299 | $939,648 | $281,894 | $657,754 |
| 2015 | $13,127 | $925,541 | $277,662 | $647,879 |
| 2014 | $12,421 | $850,000 | $255,000 | $595,000 |
Source: Public Records
Map
Nearby Homes
- 1408 Henry St
- 1425 Martin Luther King jr Way
- 1444 Walnut St
- 1610 Milvia St
- 1609 Bonita Ave Unit 5
- 1515 Oxford St Unit 1D
- 1625 Martin Luther King jr Way
- 1808 Cedar St
- 2121 Eunice St
- 1682 Oxford St
- 1950 Hopkins St
- 2201 Virginia St Unit 2
- 1626 Hopkins St
- 1622 Scenic Ave
- 2315 Eunice St
- 1739 Spruce St
- 2340 Virginia St
- 2421 Hilgard Ave
- 2501 Rose Walk
- 2477 Virginia St
- 1408 Milvia St
- 1414 Milvia St
- 1950 Rose St Unit 2
- 1950 Rose St
- 1416 Milvia St
- 1934 Rose St
- 1418 Milvia St
- 1413 Bonita Ave
- 1422 Milvia St
- 1403 Bonita Ave
- 1415 Bonita Ave
- 1401 Bonita Ave Unit 2
- 1401 Bonita Ave Unit 2
- 1409 Milvia St
- 1401 Milvia St Unit 2000
- 1403 Milvia St
- 1417 Bonita Ave
- 1424 Milvia St
- 1947 Rose St
- 1943 Rose St
Your Personal Tour Guide
Ask me questions while you tour the home.