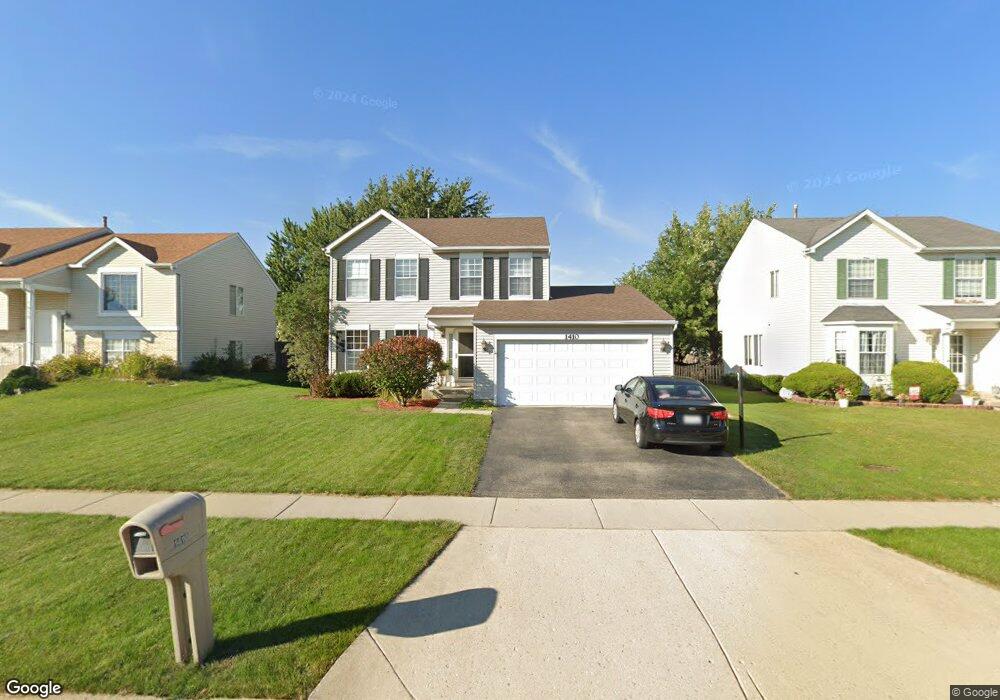
1410 N Blackhawk Cir South Elgin, IL 60177
Estimated Value: $373,000 - $394,000
3
Beds
3
Baths
1,725
Sq Ft
$222/Sq Ft
Est. Value
About This Home
This home is located at 1410 N Blackhawk Cir, South Elgin, IL 60177 and is currently estimated at $383,745, approximately $222 per square foot. 1410 N Blackhawk Cir is a home located in Kane County with nearby schools including Fox Meadow Elementary School, Kenyon Woods Middle School, and South Elgin High School.
Ownership History
Date
Name
Owned For
Owner Type
Purchase Details
Closed on
Apr 6, 2022
Sold by
Jana Mikhail
Bought by
Jana Mikhail Revocable Living Trust
Current Estimated Value
Purchase Details
Closed on
Apr 7, 2005
Sold by
Weinrich Tomas J and Weinrich Deborah J
Bought by
Vaneck Elizabeth
Home Financials for this Owner
Home Financials are based on the most recent Mortgage that was taken out on this home.
Original Mortgage
$270,000
Interest Rate
7.23%
Mortgage Type
Stand Alone First
Purchase Details
Closed on
Jun 6, 1998
Sold by
Kingsport Development Inc
Bought by
Weinrich Tomas J and Weinrich Deborah J
Home Financials for this Owner
Home Financials are based on the most recent Mortgage that was taken out on this home.
Original Mortgage
$155,777
Interest Rate
7.22%
Mortgage Type
FHA
Create a Home Valuation Report for This Property
The Home Valuation Report is an in-depth analysis detailing your home's value as well as a comparison with similar homes in the area
Home Values in the Area
Average Home Value in this Area
Purchase History
| Date | Buyer | Sale Price | Title Company |
|---|---|---|---|
| Jana Mikhail Revocable Living Trust | -- | Hippie Roxanna Al | |
| Vaneck Elizabeth | $270,000 | Ticor Title Insurance Co | |
| Weinrich Tomas J | $163,500 | Chicago Title Insurance Co |
Source: Public Records
Mortgage History
| Date | Status | Borrower | Loan Amount |
|---|---|---|---|
| Previous Owner | Vaneck Elizabeth | $270,000 | |
| Previous Owner | Weinrich Tomas J | $155,777 |
Source: Public Records
Tax History Compared to Growth
Tax History
| Year | Tax Paid | Tax Assessment Tax Assessment Total Assessment is a certain percentage of the fair market value that is determined by local assessors to be the total taxable value of land and additions on the property. | Land | Improvement |
|---|---|---|---|---|
| 2024 | $7,568 | $111,903 | $28,317 | $83,586 |
| 2023 | $7,811 | $101,096 | $25,582 | $75,514 |
| 2022 | $7,416 | $92,182 | $23,326 | $68,856 |
| 2021 | $6,983 | $86,183 | $21,808 | $64,375 |
| 2020 | $6,772 | $82,275 | $20,819 | $61,456 |
| 2019 | $6,521 | $78,372 | $19,831 | $58,541 |
| 2018 | $6,393 | $73,831 | $18,682 | $55,149 |
| 2017 | $6,075 | $69,797 | $17,661 | $52,136 |
| 2016 | $5,784 | $64,753 | $16,385 | $48,368 |
| 2015 | -- | $59,352 | $15,018 | $44,334 |
| 2014 | -- | $54,942 | $14,833 | $40,109 |
| 2013 | -- | $56,391 | $15,224 | $41,167 |
Source: Public Records
Map
Nearby Homes
- 435 Sandhurst Ln Unit 3
- 1458 Woodland Dr
- 1370 Marleigh Ln
- 1419 S Pembroke Dr
- 8N594 S Mclean Blvd
- 1063 Manchester Ct Unit 1
- 671 Fieldcrest Dr
- 590 Fenwick Ln
- 387 S Pointe Ave
- 2300 Vineyard Ct
- 126 Kingsport Dr
- 962 Ascot Dr
- 2359 Nantucket Ln Unit 9
- 1091 Delta Dr Unit 305E
- 962 Annandale Dr
- 286 Kingsport Dr
- 281 Kingsport Dr
- 282 Kingsport Dr
- 283 Kingsport Dr
- 280 Kingsport Dr
- 1400 N Blackhawk Cir
- 1418 N Blackhawk Cir
- 1392 N Blackhawk Cir
- 1424 N Blackhawk Cir
- 3 Marcia Ct
- 1 Marcia Ct
- 5 Marcia Ct
- 1432 N Blackhawk Cir
- 1391 Burke Ln
- 1380 N Blackhawk Cir
- 1405 N Blackhawk Cir
- 1415 N Blackhawk Cir
- 1401 N Blackhawk Cir
- 1421 N Blackhawk Cir
- 1427 N Blackhawk Cir
- 1381 Burke Ln
- 1438 N Blackhawk Cir
- 1389 N Blackhawk Cir
- 7 Marcia Ct
- 1429 N Blackhawk Cir