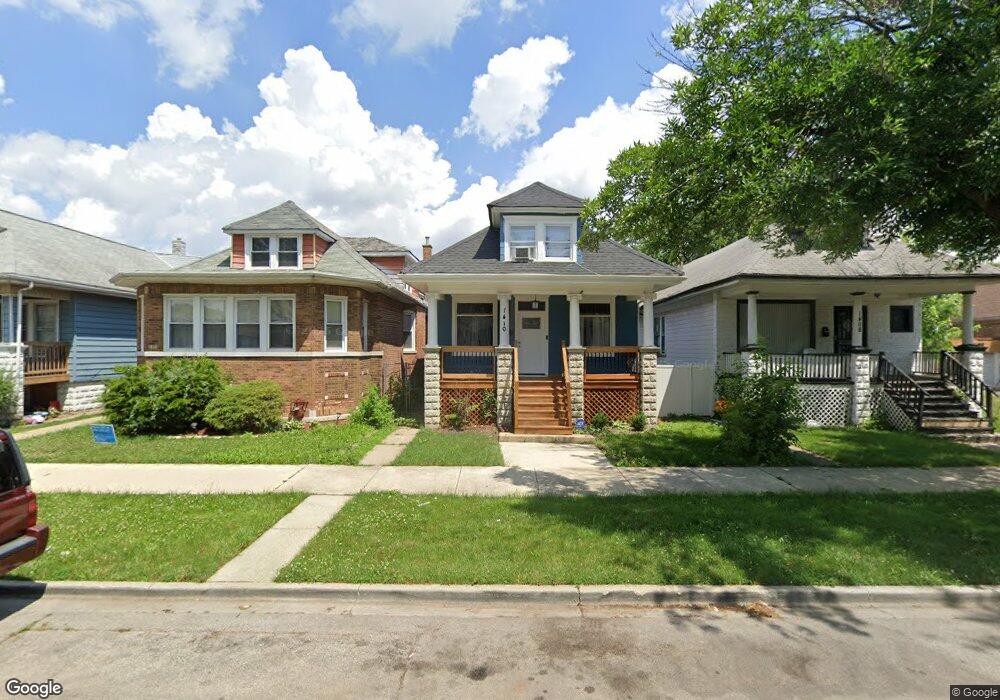
1410 W 72nd St Unit 2 Chicago, IL 60636
Englewood NeighborhoodEstimated Value: $156,000 - $268,000
3
Beds
2
Baths
1,100
Sq Ft
$194/Sq Ft
Est. Value
About This Home
This home is located at 1410 W 72nd St Unit 2, Chicago, IL 60636 and is currently estimated at $213,905, approximately $194 per square foot. 1410 W 72nd St Unit 2 is a home located in Cook County with nearby schools including Wentworth Elementary School and The Montessori School of Englewood Charter School.
Ownership History
Date
Name
Owned For
Owner Type
Purchase Details
Closed on
Apr 29, 2025
Sold by
Dela Cruz Herminia and Murphy Jessica T
Bought by
Dela Cruz Herminia and Argueta Oscar Leonel
Current Estimated Value
Home Financials for this Owner
Home Financials are based on the most recent Mortgage that was taken out on this home.
Original Mortgage
$248,651
Outstanding Balance
$247,807
Interest Rate
6.87%
Mortgage Type
FHA
Estimated Equity
-$33,902
Purchase Details
Closed on
Aug 15, 2024
Sold by
Fils Kenneth and Schofield Cheryl
Bought by
Murphy Jessica T and De La Cruz
Home Financials for this Owner
Home Financials are based on the most recent Mortgage that was taken out on this home.
Original Mortgage
$241,656
Interest Rate
7.13%
Mortgage Type
FHA
Purchase Details
Closed on
Jul 7, 2020
Sold by
Chicago Title Land Trust Company
Bought by
Schofield Cheryl and Fils Kenneth
Create a Home Valuation Report for This Property
The Home Valuation Report is an in-depth analysis detailing your home's value as well as a comparison with similar homes in the area
Home Values in the Area
Average Home Value in this Area
Purchase History
| Date | Buyer | Sale Price | Title Company |
|---|---|---|---|
| Dela Cruz Herminia | -- | None Listed On Document | |
| Murphy Jessica T | $250,000 | None Listed On Document | |
| Schofield Cheryl | $25,000 | Fidelity National Title |
Source: Public Records
Mortgage History
| Date | Status | Borrower | Loan Amount |
|---|---|---|---|
| Open | Dela Cruz Herminia | $248,651 | |
| Previous Owner | Murphy Jessica T | $241,656 |
Source: Public Records
Tax History Compared to Growth
Tax History
| Year | Tax Paid | Tax Assessment Tax Assessment Total Assessment is a certain percentage of the fair market value that is determined by local assessors to be the total taxable value of land and additions on the property. | Land | Improvement |
|---|---|---|---|---|
| 2024 | $738 | $5,300 | $1,125 | $4,175 |
| 2023 | $719 | $3,500 | $1,898 | $1,602 |
| 2022 | $719 | $3,500 | $1,898 | $1,602 |
| 2021 | $703 | $3,498 | $1,897 | $1,601 |
| 2020 | $1,399 | $6,279 | $2,812 | $3,467 |
| 2019 | $1,402 | $6,977 | $2,812 | $4,165 |
| 2018 | $1,378 | $6,977 | $2,812 | $4,165 |
| 2017 | $1,983 | $9,213 | $2,437 | $6,776 |
| 2016 | $988 | $9,213 | $2,437 | $6,776 |
| 2015 | $864 | $9,213 | $2,437 | $6,776 |
| 2014 | $1,023 | $8,082 | $2,250 | $5,832 |
| 2013 | $992 | $8,082 | $2,250 | $5,832 |
Source: Public Records
Map
Nearby Homes
- 1408 W 71st Place
- 1508 W 72nd St
- 1500 W 71st St
- 7050 S Throop St
- 1467 W 73rd St
- 1241 W 72nd Place
- 7041 S Throop St
- 6953 S Loomis Blvd
- 7019 S Throop St
- 6946 S Loomis Blvd
- 7022 S Elizabeth St
- 1240 W 73rd Place
- 7241 S Marshfield Ave
- 6943 S Ada St
- 7253 S Marshfield Ave
- 6939 S Ada St
- 7300 S Racine Ave
- 6929 S Loomis Blvd
- 7144 S May St
- 7128 S May St
- 1410 W 72nd St
- 1408 W 72nd St
- 1414 W 72nd St
- 1404 W 72nd St
- 1416 W 72nd St
- 1418 W 72nd St
- 1400 W 72nd St
- 1422 W 72nd St
- 1415 W 71st Place
- 1424 W 72nd St
- 1405 W 71st Place
- 1405 W 71st Place
- 1417 W 71st Place
- 1411 W 71st Place
- 1409 W 71st Place Unit 2
- 1421 W 71st Place
- 1401 W 71st Place
- 1428 W 72nd St
- 1423 W 71st Place
- 1409 W 72nd St