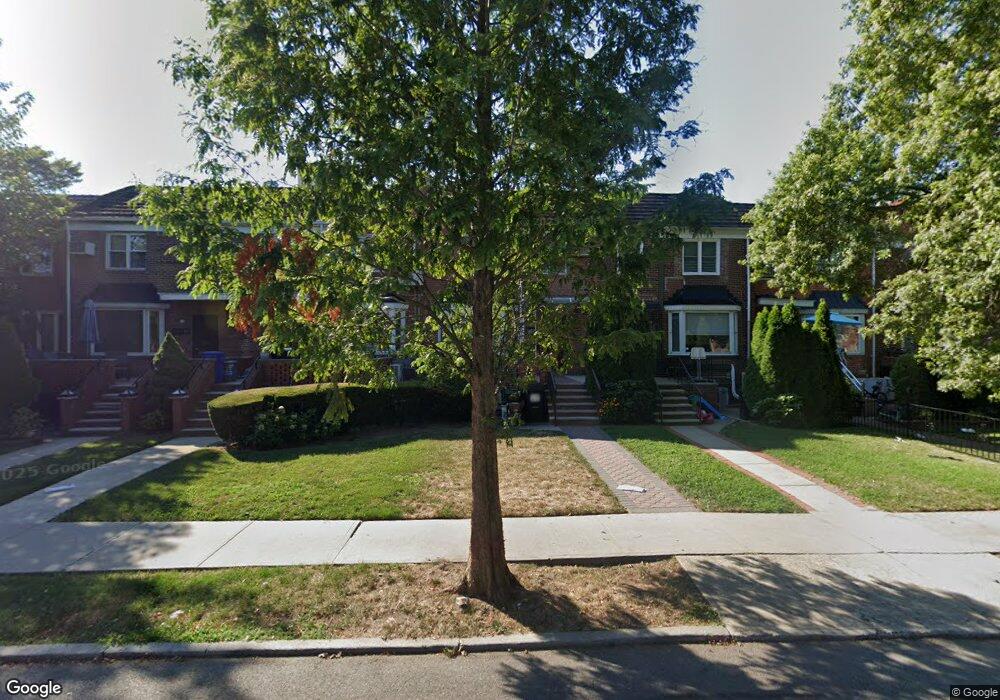
14106 70th Rd Flushing, NY 11367
Kew Gardens Hills NeighborhoodEstimated Value: $1,051,750 - $1,255,000
Studio
--
Bath
1,704
Sq Ft
$668/Sq Ft
Est. Value
About This Home
This home is located at 14106 70th Rd, Flushing, NY 11367 and is currently estimated at $1,137,438, approximately $667 per square foot. 14106 70th Rd is a home located in Queens County with nearby schools including P.S. 164 - Queens Valley, I.S. 250 - The Robert F. Kennedy Community Middle School, and Yeshiva Of Central Queens.
Ownership History
Date
Name
Owned For
Owner Type
Purchase Details
Closed on
Oct 10, 2013
Sold by
Allen Daniel Nathan and Allen Tami Gail
Bought by
Sionov Albert and Sionov Mira
Current Estimated Value
Home Financials for this Owner
Home Financials are based on the most recent Mortgage that was taken out on this home.
Original Mortgage
$225,000
Outstanding Balance
$169,463
Interest Rate
4.56%
Mortgage Type
New Conventional
Estimated Equity
$967,975
Purchase Details
Closed on
Mar 12, 2009
Sold by
Blonder Meir
Bought by
Allen Daniel N and Allen Tami G
Home Financials for this Owner
Home Financials are based on the most recent Mortgage that was taken out on this home.
Original Mortgage
$367,000
Interest Rate
5.25%
Mortgage Type
Purchase Money Mortgage
Purchase Details
Closed on
Sep 5, 1995
Sold by
Schwartz Michael and Schwartz Michelle
Bought by
Blonder Meir Y
Home Financials for this Owner
Home Financials are based on the most recent Mortgage that was taken out on this home.
Original Mortgage
$99,955
Interest Rate
7.8%
Create a Home Valuation Report for This Property
The Home Valuation Report is an in-depth analysis detailing your home's value as well as a comparison with similar homes in the area
Home Values in the Area
Average Home Value in this Area
Purchase History
| Date | Buyer | Sale Price | Title Company |
|---|---|---|---|
| Sionov Albert | $705,000 | -- | |
| Allen Daniel N | $667,000 | -- | |
| Blonder Meir Y | -- | Commonwealth Land Title Ins |
Source: Public Records
Mortgage History
| Date | Status | Borrower | Loan Amount |
|---|---|---|---|
| Open | Sionov Albert | $225,000 | |
| Previous Owner | Allen Daniel N | $367,000 | |
| Previous Owner | Blonder Meir Y | $99,955 |
Source: Public Records
Tax History
| Year | Tax Paid | Tax Assessment Tax Assessment Total Assessment is a certain percentage of the fair market value that is determined by local assessors to be the total taxable value of land and additions on the property. | Land | Improvement |
|---|---|---|---|---|
| 2025 | $9,227 | $49,783 | $13,568 | $36,215 |
| 2024 | $9,239 | $47,342 | $14,798 | $32,544 |
| 2018 | $7,557 | $38,530 | $12,129 | $26,401 |
| 2017 | $7,502 | $38,272 | $14,502 | $23,770 |
| 2016 | $6,961 | $38,272 | $14,502 | $23,770 |
| 2015 | $4,135 | $34,572 | $15,695 | $18,877 |
| 2014 | $4,135 | $32,877 | $15,422 | $17,455 |
Source: Public Records
Map
Nearby Homes
- 7012 141st St
- 13772 70th Ave
- 14101 Jewel Ave
- 144-24 Jewel Ave
- 138-55 Jewel Ave Unit 2nd Fl
- 147-03 71st Ave Unit 55B
- 140-49 69th Rd
- 144-52 Jewel Ave
- 147-01 70th Ave
- 138-29 Jewel Ave Unit 3D
- 138-35 Jewel Ave Unit 1B
- 138-01A Jewel Ave Unit 1A
- 68-56 140th St Unit Upper
- 138-33 Jewel Ave Unit 3Q
- 141-67 72nd Crescent
- 6809 138th St Unit 2C
- 147-11 Jewel Ave
- 68-36 140th St Unit B
- 140-14 68th Dr
- 138-46 68th Dr Unit A
- 14104 70th Rd
- 14108 70th Rd
- 141-02A70 Road
- 14102A 70th Rd Unit 141-02
- 14110 70th Rd
- 14112 70th Rd
- 141-24 70th Rd
- 14102 70th Rd
- 14114 70th Rd
- 14114 70th Rd
- 14116 70th Rd
- 14115 71st Ave
- 14111 71st Ave
- 14117 71st Ave
- 14109 71st Ave
- 14119 71st Ave
- 141-17 71st Ave Unit HOUSE
- 141-17 71st Ave
- 14118 70th Rd
- 14107 71st Ave
Your Personal Tour Guide
Ask me questions while you tour the home.