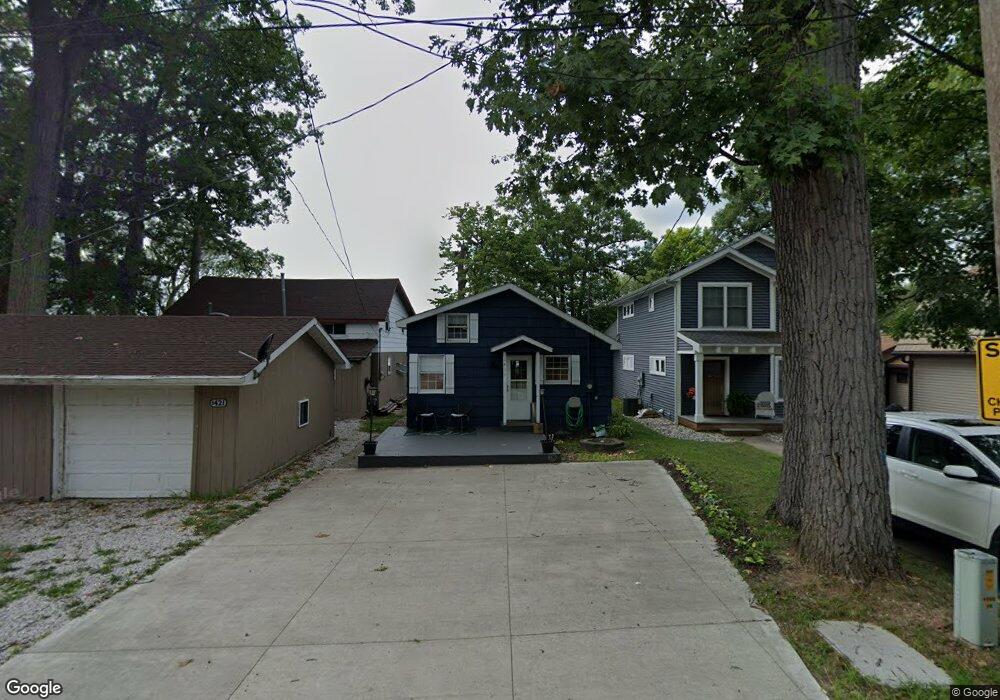
1411 Charlotte Landing Rd Springport, MI 49284
Estimated Value: $381,000 - $440,000
--
Bed
--
Bath
1,052
Sq Ft
$392/Sq Ft
Est. Value
About This Home
This home is located at 1411 Charlotte Landing Rd, Springport, MI 49284 and is currently estimated at $412,615, approximately $392 per square foot. 1411 Charlotte Landing Rd is a home located in Calhoun County with nearby schools including Springport Elementary School, Springport Middle School, and Springport High School.
Ownership History
Date
Name
Owned For
Owner Type
Purchase Details
Closed on
Mar 26, 2010
Sold by
Ebner Eric and Emil Eric Ebner Keogh Plan
Bought by
Ebner Eric and Ebner Allison
Current Estimated Value
Purchase Details
Closed on
Mar 23, 2007
Sold by
Marshall Property Management Llc
Bought by
Emil Eric Ebner Keogh Plan
Purchase Details
Closed on
Jan 12, 2005
Sold by
Ebner Allison M
Bought by
Marshall Property Management Llc
Purchase Details
Closed on
May 5, 2004
Sold by
Ebner Emil Eric
Bought by
Marshall Property Management Llc
Purchase Details
Closed on
Apr 15, 2004
Sold by
Marshall Property Management Llc
Bought by
Ebner Emil Eric
Purchase Details
Closed on
Mar 27, 2002
Sold by
Dillon Richard and Dillon Caroline
Bought by
Ebner Eric and Ebner Allison
Purchase Details
Closed on
Aug 6, 1998
Sold by
Aitken Joelyn
Bought by
Dillon Richard and Dillon Caroline
Purchase Details
Closed on
Jan 25, 1993
Bought by
Aitken
Create a Home Valuation Report for This Property
The Home Valuation Report is an in-depth analysis detailing your home's value as well as a comparison with similar homes in the area
Home Values in the Area
Average Home Value in this Area
Purchase History
| Date | Buyer | Sale Price | Title Company |
|---|---|---|---|
| Ebner Eric | -- | None Available | |
| Emil Eric Ebner Keogh Plan | -- | Otc | |
| Marshall Property Management Llc | -- | -- | |
| Marshall Property Management Llc | -- | -- | |
| Ebner Emil Eric | -- | -- | |
| Ebner Eric | $175,000 | -- | |
| Dillon Richard | $118,500 | -- | |
| Aitken | $79,900 | -- |
Source: Public Records
Tax History Compared to Growth
Tax History
| Year | Tax Paid | Tax Assessment Tax Assessment Total Assessment is a certain percentage of the fair market value that is determined by local assessors to be the total taxable value of land and additions on the property. | Land | Improvement |
|---|---|---|---|---|
| 2025 | $4,437 | $146,600 | $0 | $0 |
| 2024 | $919 | $123,100 | $0 | $0 |
| 2023 | $3,945 | $113,300 | $0 | $0 |
| 2022 | $3,945 | $100,500 | $0 | $0 |
| 2021 | $3,783 | $90,500 | $0 | $0 |
| 2020 | $3,783 | $90,700 | $0 | $0 |
| 2019 | $0 | $82,000 | $0 | $0 |
| 2018 | $0 | $72,000 | $30,400 | $41,600 |
| 2017 | $0 | $72,200 | $0 | $0 |
| 2016 | $0 | $69,700 | $0 | $0 |
| 2015 | -- | $66,800 | $1,146 | $65,654 |
| 2014 | -- | $64,400 | $1,146 | $63,254 |
Source: Public Records
Map
Nearby Homes
- 1551 Charlotte Landing Rd
- 2321 Country Club Way
- 21602 26 Mile Rd
- 4643 Anderson Rd
- 20933 26 Mile Rd
- 26838 Q-Drive N
- 26506 E Baseline Hwy
- 19822 27 1 2 Mile Rd
- 29510 S Dr N
- 0 R-Drive N
- 8746 Lake Dr
- 8659 Narrow Lake Rd
- 3040 Luella Ln
- 998 E Butterfield Hwy
- 16711 Stark Rd
- 15885 Mcclellan Rd
- 8839 Timber Ln
- 16594 Stark Rd
- 1422 E Bellevue Hwy
- 0 Green St
- 1401 Charlotte Landing Rd
- 1391 Charlotte Landing Rd
- 1432 Charlotte Landing Rd
- 1441 Charlotte Landing Rd
- 1441 Charlotte Landing Rd Unit 110-239-00
- 1381 Charlotte Landing Rd
- 1381 Charlotte Landing Rd
- 1461 Charlotte Landing Rd
- 1433 Charlotte Landing Rd
- 1361 Charlotte Landing Rd
- 1351 Charlotte Landing Rd
- 1351 Charlotte Landing Rd
- 1522 Charlotte Landing Rd
- 1481 Charlotte Landing Rd
- 1341 Charlotte Landing Rd
- 1501 Charlotte Landing Rd
- 1521 Charlotte Landing Rd
- 1531 Charlotte Landing Rd
- 1321 Charlotte Landing Rd
- 27213 T Dr N