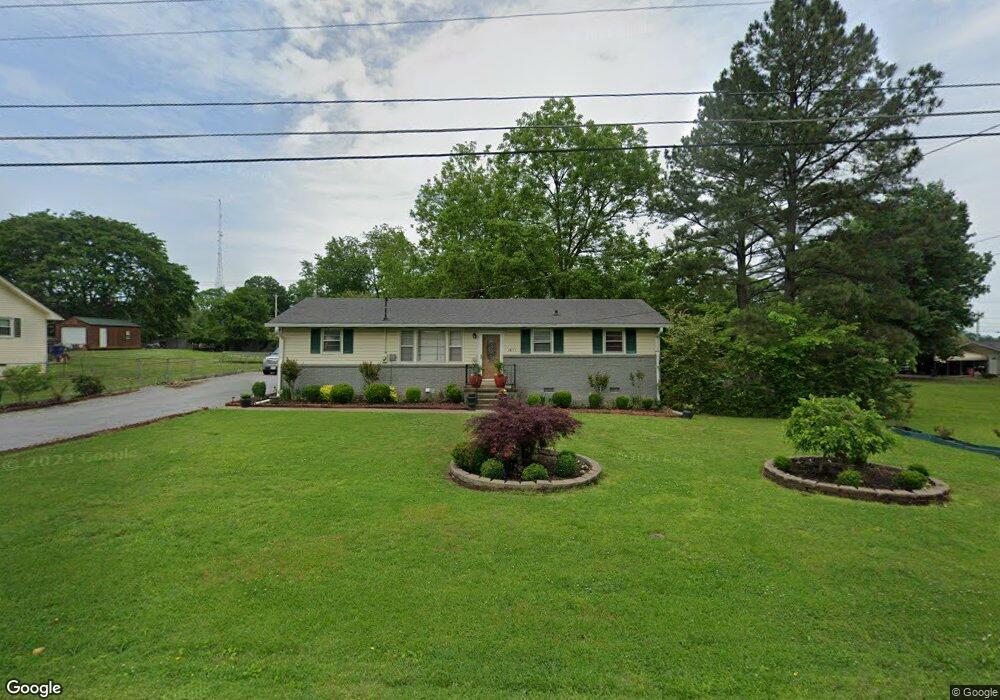
1411 Cherry St Shelbyville, TN 37160
Estimated Value: $200,000 - $268,000
3
Beds
2
Baths
1,224
Sq Ft
$183/Sq Ft
Est. Value
About This Home
This home is located at 1411 Cherry St, Shelbyville, TN 37160 and is currently estimated at $224,524, approximately $183 per square foot. 1411 Cherry St is a home located in Bedford County with nearby schools including Harris Middle School and Victory Baptist Academy.
Ownership History
Date
Name
Owned For
Owner Type
Purchase Details
Closed on
May 9, 2014
Sold by
Sullivan John
Bought by
Rodriguez Migueal A and Varas Virginia
Current Estimated Value
Home Financials for this Owner
Home Financials are based on the most recent Mortgage that was taken out on this home.
Original Mortgage
$52,900
Outstanding Balance
$40,259
Interest Rate
4.37%
Mortgage Type
New Conventional
Estimated Equity
$184,265
Purchase Details
Closed on
Oct 7, 2013
Sold by
Haynes Jeffrey Michael
Bought by
Sullivan John and Sullivan Jeff
Purchase Details
Closed on
Jun 5, 2002
Sold by
Haynes Becky
Bought by
Haynes Charles D
Purchase Details
Closed on
May 26, 1999
Sold by
Haynes Charles David
Bought by
Haynes Charles and Haynes Becky
Purchase Details
Closed on
Aug 11, 1987
Bought by
Haynes Charles David
Purchase Details
Closed on
Apr 14, 1978
Bought by
Haynes Charles David and Donna Jean
Create a Home Valuation Report for This Property
The Home Valuation Report is an in-depth analysis detailing your home's value as well as a comparison with similar homes in the area
Home Values in the Area
Average Home Value in this Area
Purchase History
| Date | Buyer | Sale Price | Title Company |
|---|---|---|---|
| Rodriguez Migueal A | $62,900 | -- | |
| Sullivan John | $43,000 | -- | |
| Haynes Charles D | -- | -- | |
| Haynes Charles | -- | -- | |
| Haynes Charles David | -- | -- | |
| Haynes Charles David | -- | -- |
Source: Public Records
Mortgage History
| Date | Status | Borrower | Loan Amount |
|---|---|---|---|
| Open | Rodriguez Migueal A | $52,900 |
Source: Public Records
Tax History Compared to Growth
Tax History
| Year | Tax Paid | Tax Assessment Tax Assessment Total Assessment is a certain percentage of the fair market value that is determined by local assessors to be the total taxable value of land and additions on the property. | Land | Improvement |
|---|---|---|---|---|
| 2025 | -- | $29,275 | $0 | $0 |
| 2024 | -- | $29,275 | $7,350 | $21,925 |
| 2023 | $1,114 | $29,275 | $7,350 | $21,925 |
| 2022 | $1,146 | $29,275 | $7,350 | $21,925 |
| 2021 | $1,040 | $29,275 | $7,350 | $21,925 |
| 2020 | $703 | $29,275 | $7,350 | $21,925 |
| 2019 | $703 | $15,875 | $3,500 | $12,375 |
| 2018 | $687 | $15,875 | $3,500 | $12,375 |
| 2017 | $687 | $15,875 | $3,500 | $12,375 |
| 2016 | $681 | $15,875 | $3,500 | $12,375 |
| 2015 | $681 | $15,875 | $3,500 | $12,375 |
| 2014 | $682 | $17,400 | $0 | $0 |
Source: Public Records
Map
Nearby Homes
- 1404 Cypress St
- 204 S Hillcrest Dr
- 1683 Madison St
- 225 Eagle Blvd
- 1725 Wartrace Pike
- 1024 Tennessee 64
- 104 Curbow Ct
- 108 Virginia Ct
- 107 Rockwood Dr
- 11 Amos Smith Rd
- 705 S Wall St
- 707 S Wall St
- 2021 Madison St
- 207 Ledbetter Rd
- 711 S Wall St
- 719 S Wall St
- 715 S Wall St
- 713 S Wall St
- 404 Ledbetter Rd
- 104 Townsend Ave
- 1409 Cherry St
- 1407 Cherry St
- 1 Cherry St
- 1410 Cherry St
- 102 Forest Ave
- 1412 Cherry St
- 1408 Cherry St
- 1414 Madison St
- 1406 Cherry St
- 1405 Cherry St
- 1414 Cherry St
- 200 Forest Ave
- 1404 Cherry St
- 1400 Madison St
- 1403 Cherry St
- 1411 Cypress St
- 1409 Cypress St
- 1413 Cypress St
- 202 Forest Ave
- 1402 Cherry St