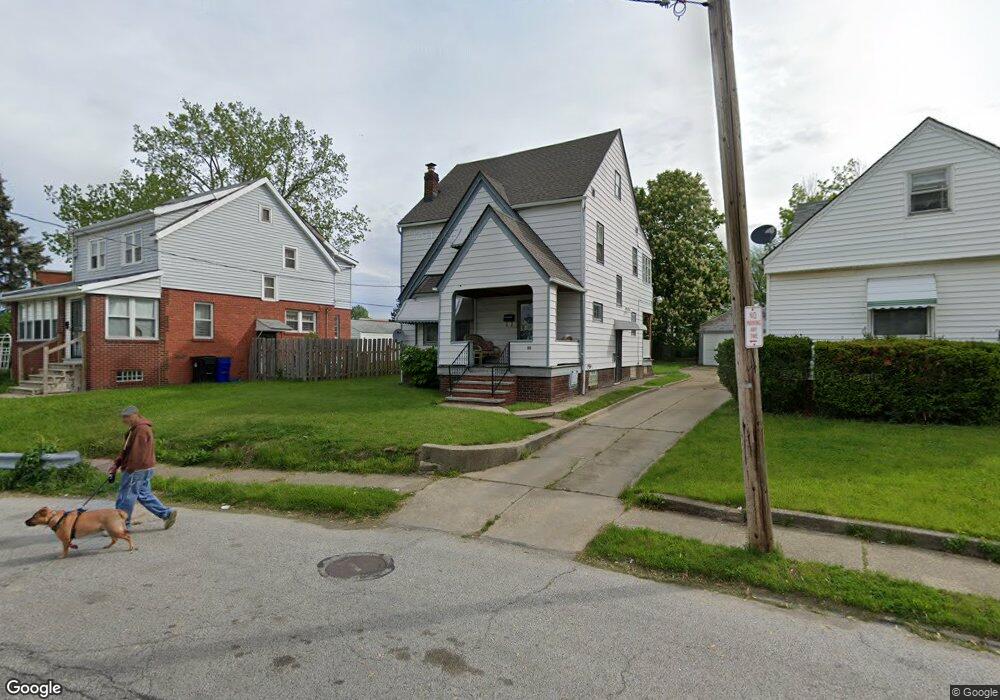
1411 Clermont Rd Cleveland, OH 44110
South Collinwood NeighborhoodEstimated Value: $85,482 - $99,000
3
Beds
1
Bath
1,279
Sq Ft
$73/Sq Ft
Est. Value
About This Home
This home is located at 1411 Clermont Rd, Cleveland, OH 44110 and is currently estimated at $93,121, approximately $72 per square foot. 1411 Clermont Rd is a home located in Cuyahoga County with nearby schools including Bolton, Andrew J. Rickoff School, and Adlai Stevenson School.
Ownership History
Date
Name
Owned For
Owner Type
Purchase Details
Closed on
Sep 9, 2013
Sold by
County Fiscal Officer Of Cuyahoga County
Bought by
Hester Janeen
Current Estimated Value
Purchase Details
Closed on
Apr 25, 2005
Sold by
Rehab A Home Ltd
Bought by
Warner Tiffany
Home Financials for this Owner
Home Financials are based on the most recent Mortgage that was taken out on this home.
Original Mortgage
$79,200
Interest Rate
6.9%
Mortgage Type
Unknown
Purchase Details
Closed on
Dec 8, 2004
Sold by
Lloyd Bette J
Bought by
Rehab A Home Ltd
Purchase Details
Closed on
May 22, 1991
Sold by
Zaller Herman J
Bought by
Lloyd Bette J
Purchase Details
Closed on
Jun 11, 1987
Sold by
Kirk Helena A
Bought by
Zaller Herman J
Purchase Details
Closed on
Oct 31, 1986
Sold by
Kirk David C and Kirk Helena A
Bought by
Kirk Helena A
Purchase Details
Closed on
Jan 1, 1975
Bought by
Kirk David C and Kirk Helena A
Create a Home Valuation Report for This Property
The Home Valuation Report is an in-depth analysis detailing your home's value as well as a comparison with similar homes in the area
Home Values in the Area
Average Home Value in this Area
Purchase History
| Date | Buyer | Sale Price | Title Company |
|---|---|---|---|
| Hester Janeen | $7,500 | Attorney | |
| Warner Tiffany | $88,000 | Sunrise | |
| Rehab A Home Ltd | $55,000 | Sunrise | |
| Lloyd Bette J | $47,000 | -- | |
| Zaller Herman J | $39,900 | -- | |
| Kirk Helena A | -- | -- | |
| Kirk David C | -- | -- |
Source: Public Records
Mortgage History
| Date | Status | Borrower | Loan Amount |
|---|---|---|---|
| Previous Owner | Warner Tiffany | $79,200 |
Source: Public Records
Tax History Compared to Growth
Tax History
| Year | Tax Paid | Tax Assessment Tax Assessment Total Assessment is a certain percentage of the fair market value that is determined by local assessors to be the total taxable value of land and additions on the property. | Land | Improvement |
|---|---|---|---|---|
| 2024 | $1,480 | $22,120 | $4,515 | $17,605 |
| 2023 | $1,102 | $14,210 | $3,080 | $11,130 |
| 2022 | $1,095 | $14,210 | $3,080 | $11,130 |
| 2021 | $1,085 | $14,210 | $3,080 | $11,130 |
| 2020 | $1,101 | $12,460 | $2,700 | $9,770 |
| 2019 | $1,020 | $35,600 | $7,700 | $27,900 |
| 2018 | $1,017 | $12,460 | $2,700 | $9,770 |
| 2017 | $1,181 | $13,970 | $2,940 | $11,030 |
| 2016 | $1,172 | $13,970 | $2,940 | $11,030 |
| 2015 | -- | $13,970 | $2,940 | $11,030 |
| 2014 | -- | $16,070 | $3,400 | $12,670 |
Source: Public Records
Map
Nearby Homes
- 1363 Clearaire Rd
- 1362 E 187th St
- 1563 Clermont Rd
- 1426 E 175th St
- 18804 Ironwood Ave
- 1477 E 195th St
- 1445 E 172nd St
- 1547 E 173rd St
- 19520 Shelton Dr
- 19416 Nyack Ct
- 1357 E 170th St
- 1617 Catalpa Rd
- 17817 Grovewood Ave
- 1166 E 176th St
- 17216 Grovewood Ave
- 1268 E 169th St
- 1707 Catalpa Rd
- 1113 E 177th St
- 1639 Avalon Rd
- 1561 E 204th St
- 1415 Clermont Rd
- 1407 Clermont Rd
- 1419 Clermont Rd
- 1403 Clermont Rd
- 1406 Clearaire Rd
- 1410 Clearaire Rd
- 1402 Clearaire Rd
- 1423 Clermont Rd
- 1414 Clearaire Rd
- 1398 Clearaire Rd
- 1418 Clearaire Rd
- 1394 Clearaire Rd
- 1406 Clermont Rd
- 1426 Clermont Rd
- 1422 Clearaire Rd
- 1431 Clermont Rd
- 1430 Clermont Rd
- 1419 Larchmont Rd
- 1426 Clearaire Rd
- 1435 Clermont Rd