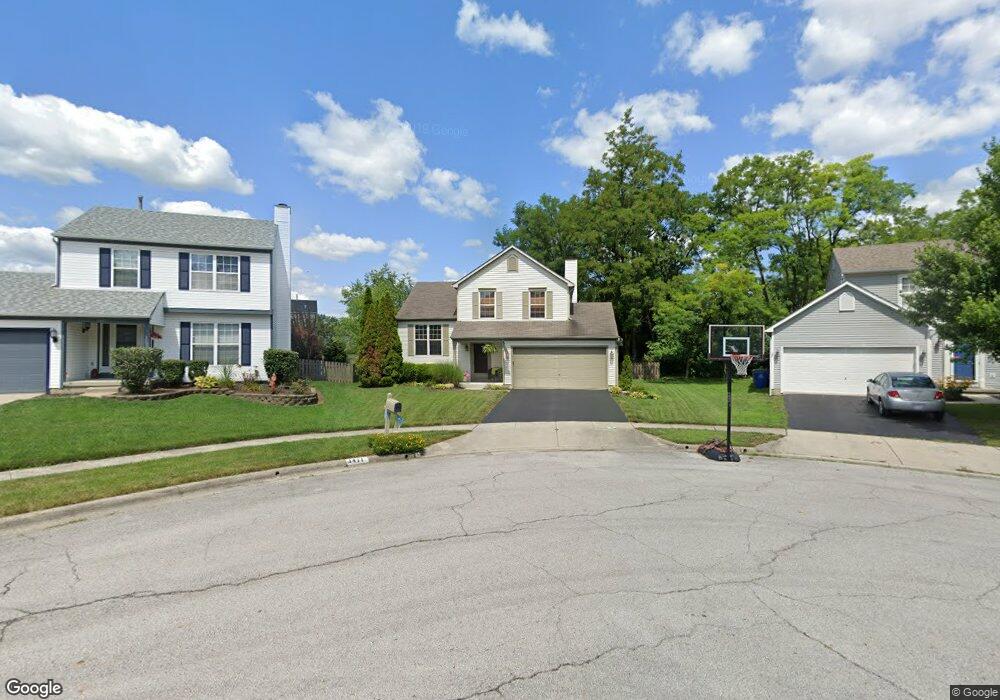
1411 Dillingham Ct Columbus, OH 43228
Trabue Woods NeighborhoodEstimated Value: $326,294 - $343,000
3
Beds
3
Baths
1,382
Sq Ft
$243/Sq Ft
Est. Value
About This Home
This home is located at 1411 Dillingham Ct, Columbus, OH 43228 and is currently estimated at $336,074, approximately $243 per square foot. 1411 Dillingham Ct is a home located in Franklin County with nearby schools including Galloway Ridge Intermediate School, Prairie Lincoln Elementary School, and Norton Middle School.
Ownership History
Date
Name
Owned For
Owner Type
Purchase Details
Closed on
Oct 9, 2014
Sold by
Krumlauf Lisa
Bought by
Wilimitis Cynthia Ann
Current Estimated Value
Home Financials for this Owner
Home Financials are based on the most recent Mortgage that was taken out on this home.
Original Mortgage
$102,500
Interest Rate
4.08%
Mortgage Type
New Conventional
Purchase Details
Closed on
Jun 10, 2011
Sold by
Wilimitis Cynthia Ann
Bought by
Wilimitis Cynthia Ann and Krumlauf Lisa
Purchase Details
Closed on
Feb 22, 2002
Sold by
Ray Florence L
Bought by
Wilimitis Cynthia A
Purchase Details
Closed on
May 17, 1996
Sold by
Borror Corp
Bought by
Ray Cynthia Wilimitis and Ray Florence L
Home Financials for this Owner
Home Financials are based on the most recent Mortgage that was taken out on this home.
Original Mortgage
$116,462
Interest Rate
7.86%
Mortgage Type
FHA
Create a Home Valuation Report for This Property
The Home Valuation Report is an in-depth analysis detailing your home's value as well as a comparison with similar homes in the area
Home Values in the Area
Average Home Value in this Area
Purchase History
| Date | Buyer | Sale Price | Title Company |
|---|---|---|---|
| Wilimitis Cynthia Ann | $77,700 | Amerititle | |
| Wilimitis Cynthia Ann | -- | None Available | |
| Wilimitis Cynthia A | -- | -- | |
| Ray Cynthia Wilimitis | $126,675 | -- |
Source: Public Records
Mortgage History
| Date | Status | Borrower | Loan Amount |
|---|---|---|---|
| Closed | Wilimitis Cynthia Ann | $102,500 | |
| Previous Owner | Ray Cynthia Wilimitis | $116,462 |
Source: Public Records
Tax History Compared to Growth
Tax History
| Year | Tax Paid | Tax Assessment Tax Assessment Total Assessment is a certain percentage of the fair market value that is determined by local assessors to be the total taxable value of land and additions on the property. | Land | Improvement |
|---|---|---|---|---|
| 2024 | $3,312 | $90,830 | $29,050 | $61,780 |
| 2023 | $3,253 | $90,825 | $29,050 | $61,775 |
| 2022 | $3,297 | $67,560 | $13,130 | $54,430 |
| 2021 | $3,363 | $67,560 | $13,130 | $54,430 |
| 2020 | $3,344 | $67,560 | $13,130 | $54,430 |
| 2019 | $2,984 | $53,200 | $10,500 | $42,700 |
| 2018 | $3,130 | $53,200 | $10,500 | $42,700 |
| 2017 | $3,123 | $53,200 | $10,500 | $42,700 |
| 2016 | $3,289 | $54,360 | $10,710 | $43,650 |
| 2015 | $3,289 | $54,360 | $10,710 | $43,650 |
| 2014 | $3,292 | $54,360 | $10,710 | $43,650 |
| 2013 | $1,633 | $54,355 | $10,710 | $43,645 |
Source: Public Records
Map
Nearby Homes
- 4451 Sherwill Rd
- 1175 Onaway Ct
- 4000 Sandy Ridge Dr
- 3761 Gibbstone Dr
- 3757 Gibbstone Dr
- 3664 Grimes Dr
- 3570 Dover Rd
- 4589 Annhurst Rd
- 3495 La Coste Ln
- 2051 Tuckaway Ct
- 2424 Mills Fall Dr
- 271 Carilla Ln
- 1024 Hartford Village Blvd Unit 1024
- 450 Lawrence Ave
- 218 Darbyhurst Rd
- 1152 Kinneton Unit 1152
- 3254 Dover Rd
- 3252 Dover Rd
- 316 Sturbridge Rd
- 960 Hartford Village Blvd
- 1401 Dillingham Ct
- 1419 Dillingham Ct
- 1420 Trabue Woods Blvd
- 1428 Trabue Woods Blvd
- 1412 Trabue Woods Blvd
- 1436 Trabue Woods Blvd
- 1422 Dillingham Ct
- 4663 Tramont Ct
- 4669 Tramont Ct
- 1414 Dillingham Ct
- 1388 Trabue Woods Blvd
- 1406 Dillingham Ct
- 1398 Dillingham Ct
- 4675 Tramont Ct
- 1380 Trabue Woods Blvd
- 4657 Tramont Ct
- 1390 Dillingham Ct
- 1421 Trabue Woods Blvd
- 1415 Trabue Woods Blvd
- 1433 Trabue Woods Blvd