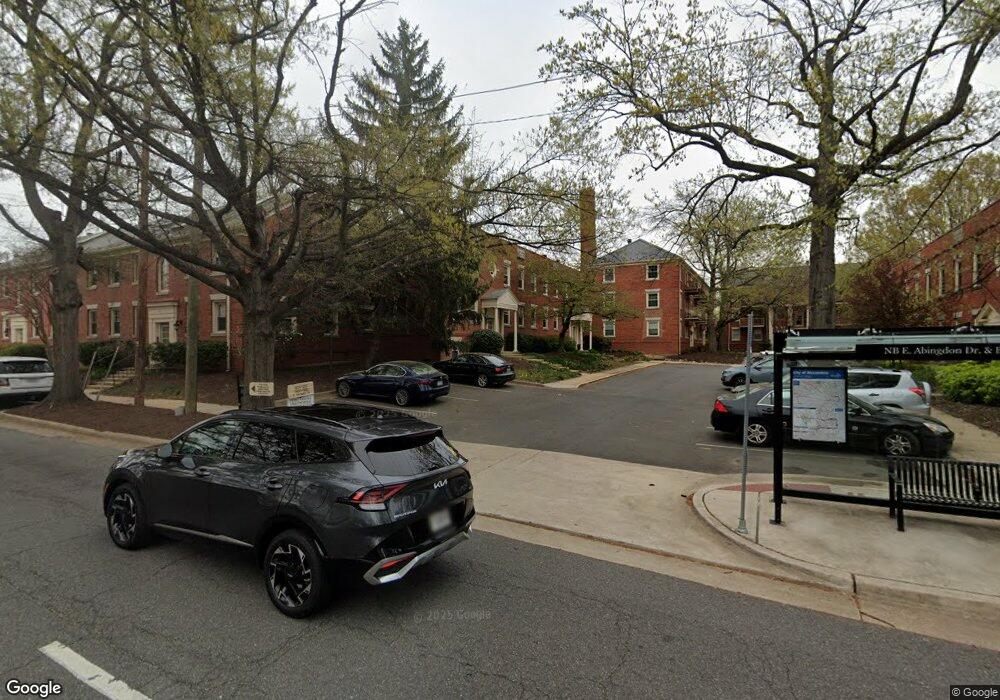
1411 E Abingdon Dr Unit 3 Alexandria, VA 22314
Old Town NeighborhoodEstimated Value: $284,000 - $355,000
Studio
--
Bath
650
Sq Ft
$478/Sq Ft
Est. Value
About This Home
This home is located at 1411 E Abingdon Dr Unit 3, Alexandria, VA 22314 and is currently estimated at $310,644, approximately $477 per square foot. 1411 E Abingdon Dr Unit 3 is a home located in Alexandria City with nearby schools including Jefferson-Houston Elementary School, Alexandria City High School, and Potomac Crescent Waldorf School.
Ownership History
Date
Name
Owned For
Owner Type
Purchase Details
Closed on
Jul 28, 2023
Sold by
Brimberry Darrell L
Bought by
Henzler Matthew and Barringer Laura Hearne
Current Estimated Value
Home Financials for this Owner
Home Financials are based on the most recent Mortgage that was taken out on this home.
Original Mortgage
$233,600
Outstanding Balance
$228,157
Interest Rate
6.69%
Mortgage Type
New Conventional
Estimated Equity
$82,487
Purchase Details
Closed on
Oct 1, 2001
Sold by
Nizoloski Philip T
Bought by
Brimberry Will
Home Financials for this Owner
Home Financials are based on the most recent Mortgage that was taken out on this home.
Original Mortgage
$108,000
Interest Rate
6.91%
Mortgage Type
New Conventional
Purchase Details
Closed on
Dec 14, 1995
Sold by
Mcgehee John M
Bought by
Valentine Marty J
Home Financials for this Owner
Home Financials are based on the most recent Mortgage that was taken out on this home.
Original Mortgage
$82,500
Interest Rate
7.43%
Create a Home Valuation Report for This Property
The Home Valuation Report is an in-depth analysis detailing your home's value as well as a comparison with similar homes in the area
Home Values in the Area
Average Home Value in this Area
Purchase History
| Date | Buyer | Sale Price | Title Company |
|---|---|---|---|
| Henzler Matthew | $292,000 | Allied Title & Escrow | |
| Brimberry Will | $135,500 | -- | |
| Valentine Marty J | $85,000 | -- |
Source: Public Records
Mortgage History
| Date | Status | Borrower | Loan Amount |
|---|---|---|---|
| Open | Henzler Matthew | $233,600 | |
| Previous Owner | Brimberry Will | $108,000 | |
| Previous Owner | Valentine Marty J | $82,500 |
Source: Public Records
Tax History
| Year | Tax Paid | Tax Assessment Tax Assessment Total Assessment is a certain percentage of the fair market value that is determined by local assessors to be the total taxable value of land and additions on the property. | Land | Improvement |
|---|---|---|---|---|
| 2025 | $3,724 | $336,316 | $105,063 | $231,253 |
| 2024 | $3,724 | $320,300 | $100,060 | $220,240 |
| 2023 | $3,486 | $314,019 | $98,098 | $215,921 |
| 2022 | $3,486 | $314,019 | $98,098 | $215,921 |
| 2021 | $3,288 | $296,246 | $92,546 | $203,700 |
| 2020 | $3,137 | $282,139 | $88,139 | $194,000 |
| 2019 | $3,008 | $266,168 | $83,150 | $183,018 |
| 2018 | $3,008 | $266,168 | $83,150 | $183,018 |
| 2017 | $2,785 | $246,452 | $76,990 | $169,462 |
| 2016 | $2,784 | $259,424 | $81,043 | $178,381 |
| 2015 | $2,706 | $259,424 | $81,043 | $178,381 |
| 2014 | $2,560 | $245,467 | $77,183 | $168,284 |
Source: Public Records
Map
Nearby Homes
- 1407 E Abingdon Dr Unit 1
- 525 Bashford Ln Unit 4
- 600 Bashford Ln Unit 2332
- 1201 N Royal St Unit 405
- 1201 N Royal St Unit 105
- 1201 N Royal St Unit 206
- 625 Slaters Ln Unit 404
- 625 Slaters Ln Unit 407
- 625 Slaters Ln Unit 401
- 625 Slaters Ln Unit 304
- 625 Slaters Ln Unit 402
- 625 Slaters Ln Unit G4
- 635 Slaters Ln Unit G-01
- 828 Slaters Ln Unit 302
- 1511 Portner Rd
- 1718 W Abingdon Dr Unit 301
- 1111 N Fairfax St Unit 503
- 1111 N Fairfax St Unit 102
- 1111 N Fairfax St Unit 310
- 1111 N Fairfax St Unit 204
- 1411 E Abingdon Dr Unit 1
- 1409 E Abingdon Dr Unit 1
- 1411 E Abingdon Dr Unit 2
- 1409 E Abingdon Dr Unit 2
- 1411 E Abingdon Dr Unit 4
- 1409 E Abingdon Dr Unit 3
- 1409 E Abingdon Dr
- 1409 #2 E Abingdon Dr
- 1413 E Abingdon Dr Unit 3
- 1413 E Abingdon Dr Unit 4
- 1415 E Abingdon Dr Unit 2
- 1415 E Abingdon Dr Unit 3
- 1413 E Abingdon Dr Unit 2
- 1415 E Abingdon Dr Unit 1
- 1415 E Abingdon Dr Unit 4
- 1405 E Abingdon Dr Unit 1
- 1407 E Abingdon Dr Unit 5
- 1407 E Abingdon Dr Unit 2
- 1405 E Abingdon Dr Unit 6
- 1405 E Abingdon Dr Unit 5
Your Personal Tour Guide
Ask me questions while you tour the home.