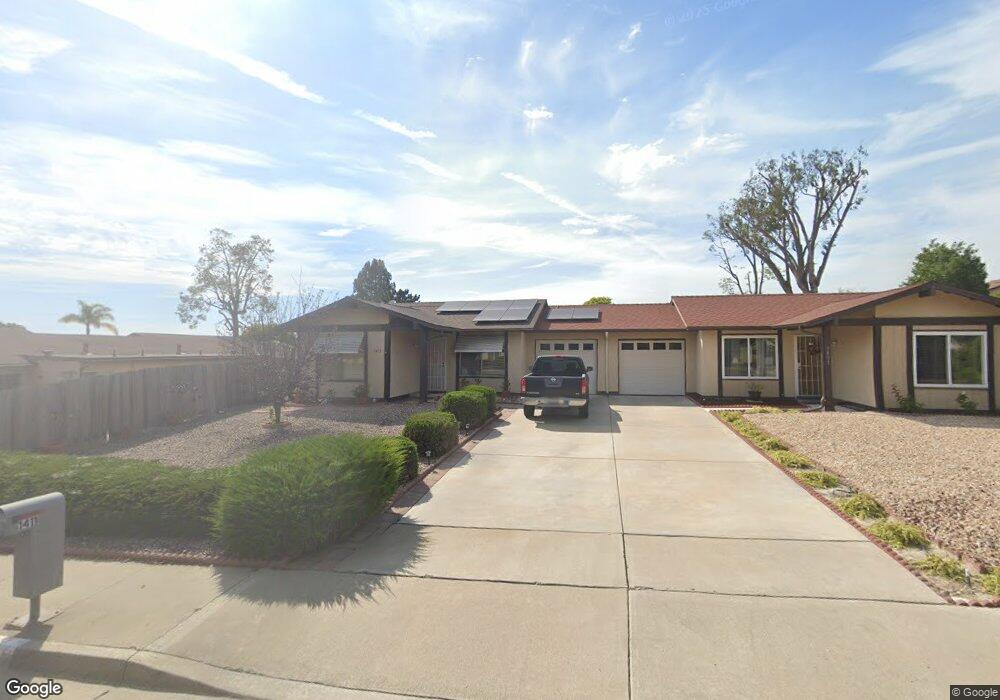
1411 Peacock Blvd Oceanside, CA 92056
Peacock NeighborhoodEstimated Value: $495,000 - $567,000
2
Beds
2
Baths
969
Sq Ft
$550/Sq Ft
Est. Value
About This Home
This home is located at 1411 Peacock Blvd, Oceanside, CA 92056 and is currently estimated at $533,240, approximately $550 per square foot. 1411 Peacock Blvd is a home located in San Diego County with nearby schools including Empresa Elementary School, Roosevelt Middle School, and Vista High School.
Ownership History
Date
Name
Owned For
Owner Type
Purchase Details
Closed on
Oct 23, 2024
Sold by
Houchins Carol Diane
Bought by
Right Now Company Llc
Current Estimated Value
Purchase Details
Closed on
Sep 29, 2014
Sold by
Tucker Donald K
Bought by
Tucker Donald
Purchase Details
Closed on
Oct 11, 2002
Sold by
Lee Sarah F
Bought by
Tucker Lloyd F and Tucker Dora L
Purchase Details
Closed on
Mar 22, 2000
Sold by
Tucker Lloyd F and Tucker Dora L
Bought by
Lee Sarah F
Home Financials for this Owner
Home Financials are based on the most recent Mortgage that was taken out on this home.
Original Mortgage
$71,000
Interest Rate
7.83%
Purchase Details
Closed on
Mar 13, 1998
Sold by
Evans Delores L Trust 03-26-93
Bought by
Tucker Lloyd F and Tucker Dora L
Home Financials for this Owner
Home Financials are based on the most recent Mortgage that was taken out on this home.
Original Mortgage
$70,000
Interest Rate
7.18%
Purchase Details
Closed on
Nov 9, 1989
Create a Home Valuation Report for This Property
The Home Valuation Report is an in-depth analysis detailing your home's value as well as a comparison with similar homes in the area
Home Values in the Area
Average Home Value in this Area
Purchase History
| Date | Buyer | Sale Price | Title Company |
|---|---|---|---|
| Right Now Company Llc | -- | None Listed On Document | |
| Houchins Carol Diane | -- | None Listed On Document | |
| Tucker Donald | -- | None Available | |
| Tucker Lloyd F | -- | -- | |
| Lee Sarah F | -- | North American Title | |
| Tucker Lloyd F | $87,500 | Commonwealth Land Title Co | |
| -- | $93,000 | -- |
Source: Public Records
Mortgage History
| Date | Status | Borrower | Loan Amount |
|---|---|---|---|
| Previous Owner | Lee Sarah F | $71,000 | |
| Previous Owner | Tucker Lloyd F | $70,000 |
Source: Public Records
Tax History
| Year | Tax Paid | Tax Assessment Tax Assessment Total Assessment is a certain percentage of the fair market value that is determined by local assessors to be the total taxable value of land and additions on the property. | Land | Improvement |
|---|---|---|---|---|
| 2025 | $2,632 | $273,363 | $185,550 | $87,813 |
| 2024 | $2,632 | $235,996 | $160,015 | $75,981 |
| 2023 | $2,569 | $231,370 | $156,878 | $74,492 |
| 2022 | $2,562 | $226,834 | $153,802 | $73,032 |
| 2021 | $2,506 | $222,387 | $150,787 | $71,600 |
| 2020 | $2,498 | $220,107 | $149,241 | $70,866 |
| 2019 | $2,462 | $215,792 | $146,315 | $69,477 |
| 2018 | $2,342 | $211,562 | $143,447 | $68,115 |
| 2017 | $2,299 | $207,415 | $140,635 | $66,780 |
| 2016 | $2,245 | $203,349 | $137,878 | $65,471 |
| 2015 | $2,236 | $200,295 | $135,807 | $64,488 |
| 2014 | $2,182 | $196,372 | $133,147 | $63,225 |
Source: Public Records
Map
Nearby Homes
- 4699 Mystik Rd
- 1413 Panorama Ridge Rd
- 1540 Highridge Dr
- 1521 Temple Heights Dr
- 1523 Temple Heights Dr
- 1400 Darwin Dr
- 4734 Rim Rock Rd
- 1376 Darwin Dr
- 475 Taylor Dr
- 4538 Sunrise Ridge
- 1433 Grey Oaks Ct
- 1702 Havenwood Dr Unit 1702
- 1351 Cottonwood Dr
- 4530 Beverly Glen Dr
- 1424 Calle Marbella
- 5216 Palmera Dr
- 1413 Eastview Ct
- 1247 Sunglow Dr
- 1549 Fig Tree Way
- 1508 Laurelwood Way
- 1407 Peacock Blvd
- 4746 Knoll Wood Ct
- 4742 Knoll Wood Ct
- 4734 Knoll Wood Ct
- 4717 Mystik Rd
- 4713 Mystik Rd Unit 3
- 4730 Knoll Wood Ct
- 4711 Mystik Rd
- 1416 Peacock Blvd
- 1420 Peacock Blvd
- 1412 Peacock Blvd
- 4707 Mystik Rd
- 1424 Peacock Blvd
- 1419 Peacock Blvd
- 4726 Knoll Wood Ct
- 1408 Peacock Blvd
- 1428 Peacock Blvd
- 4705 Mystik Rd
- 1404 Peacock Blvd
- 4722 Knoll Wood Ct
Your Personal Tour Guide
Ask me questions while you tour the home.