1411 Royer St Des Moines, IA 50316
Union Park NeighborhoodEstimated Value: $150,000 - $175,000
2
Beds
1
Bath
812
Sq Ft
$198/Sq Ft
Est. Value
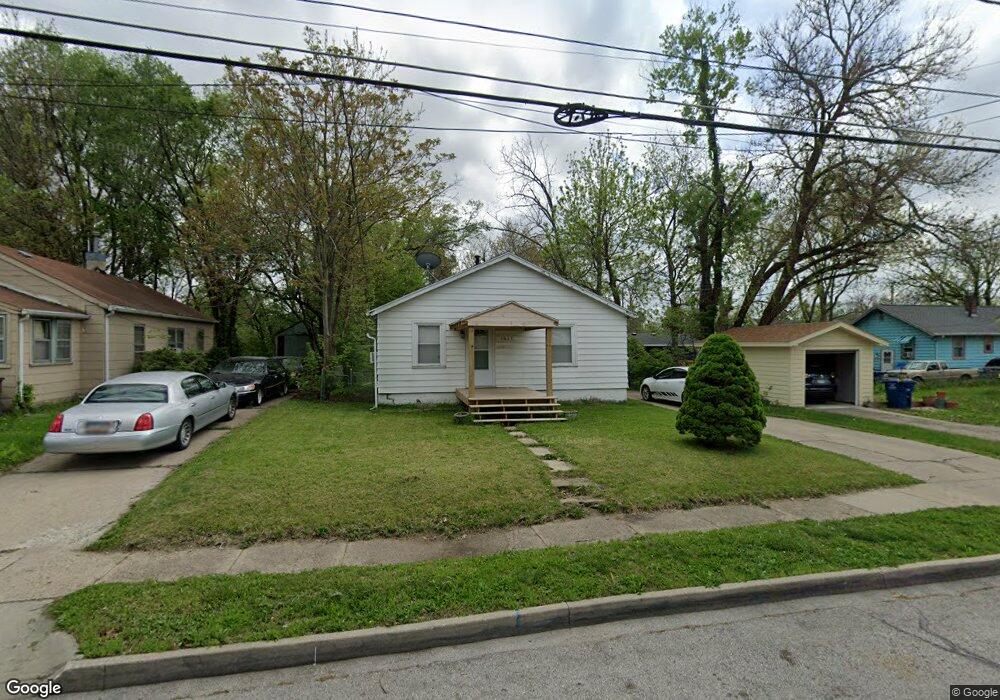
About This Home
This home is located at 1411 Royer St, Des Moines, IA 50316 and is currently estimated at $160,512, approximately $197 per square foot. 1411 Royer St is a home located in Polk County with nearby schools including Cattell Elementary School, Goodrell Middle School, and North High School.
Ownership History
Date
Name
Owned For
Owner Type
Purchase Details
Closed on
May 11, 2006
Sold by
Loveless Joel E and Loveless Sherry L
Bought by
Grimit Gary L and Grimit Rachel L
Current Estimated Value
Home Financials for this Owner
Home Financials are based on the most recent Mortgage that was taken out on this home.
Original Mortgage
$81,000
Outstanding Balance
$47,030
Interest Rate
6.54%
Mortgage Type
Fannie Mae Freddie Mac
Estimated Equity
$113,482
Purchase Details
Closed on
Sep 19, 2005
Sold by
Wells Fargo Bank Mn Na
Bought by
Loveless Joel E and Loveless Micah
Home Financials for this Owner
Home Financials are based on the most recent Mortgage that was taken out on this home.
Original Mortgage
$38,340
Interest Rate
4.87%
Mortgage Type
Fannie Mae Freddie Mac
Purchase Details
Closed on
Jun 30, 2005
Sold by
Uribe John D
Bought by
Wells Fargo Bank Mn
Purchase Details
Closed on
Oct 10, 2002
Sold by
Luloff Lonson J
Bought by
Uribe John
Home Financials for this Owner
Home Financials are based on the most recent Mortgage that was taken out on this home.
Original Mortgage
$54,400
Interest Rate
8.85%
Create a Home Valuation Report for This Property
The Home Valuation Report is an in-depth analysis detailing your home's value as well as a comparison with similar homes in the area
Home Values in the Area
Average Home Value in this Area
Purchase History
| Date | Buyer | Sale Price | Title Company |
|---|---|---|---|
| Grimit Gary L | $89,500 | Itc | |
| Loveless Joel E | $42,500 | -- | |
| Wells Fargo Bank Mn | $55,165 | -- | |
| Uribe John | $67,500 | -- | |
| Luloff Lonson J | $47,500 | -- |
Source: Public Records
Mortgage History
| Date | Status | Borrower | Loan Amount |
|---|---|---|---|
| Open | Grimit Gary L | $81,000 | |
| Previous Owner | Loveless Joel E | $38,340 | |
| Previous Owner | Uribe John | $54,400 | |
| Closed | Uribe John | $10,200 |
Source: Public Records
Tax History Compared to Growth
Tax History
| Year | Tax Paid | Tax Assessment Tax Assessment Total Assessment is a certain percentage of the fair market value that is determined by local assessors to be the total taxable value of land and additions on the property. | Land | Improvement |
|---|---|---|---|---|
| 2025 | $2,162 | $137,100 | $27,700 | $109,400 |
| 2024 | $2,162 | $120,400 | $24,200 | $96,200 |
| 2023 | $2,070 | $120,400 | $24,200 | $96,200 |
| 2022 | $2,052 | $96,700 | $20,200 | $76,500 |
| 2021 | $1,882 | $96,700 | $20,200 | $76,500 |
| 2020 | $1,950 | $84,000 | $17,600 | $66,400 |
| 2019 | $1,908 | $84,000 | $17,600 | $66,400 |
| 2018 | $1,882 | $79,500 | $16,400 | $63,100 |
| 2017 | $1,728 | $79,500 | $16,400 | $63,100 |
| 2016 | $1,678 | $72,400 | $14,900 | $57,500 |
| 2015 | $1,678 | $72,400 | $14,900 | $57,500 |
| 2014 | $1,720 | $73,400 | $14,800 | $58,600 |
Source: Public Records
Map
Nearby Homes
- 1422 Royer St
- 1432 Royer St
- 1424 Milton Ave
- 2416 York St
- 2336 E 13th St
- 1514 Guthrie Ave
- 1457 Guthrie Ave
- 2706 E 16th St
- 2127 E 13th St
- 2326 E 11th St
- 903 Morton Ave
- 1443 Wilson Ave
- 1916 York St
- 1602 Wilson Ave
- 1400 Mattern Ave
- 1913 E 13th St
- 800 E Sheridan Ave
- 2009 Glenbrook Dr
- 730 Arthur Ave
- 816 Boyd St
- 1413 Royer St
- 2503 E 14th St
- 1417 Royer St
- 2507 E 14th St
- 2423 E 14th St
- 2419 E 14th St
- 1412 Arthur Ave
- 1421 Royer St
- 1416 Arthur Ave
- 2511 E 14th St
- 2415 E 14th St
- 1410 Royer St
- 1414 Royer St
- 1427 Royer St
- 1418 Royer St
- 1405 E Sheridan Ave
- 2513 E 14th St
- 1408 Arthur Ave
- 1426 Arthur Ave
- 2517 E 14th St