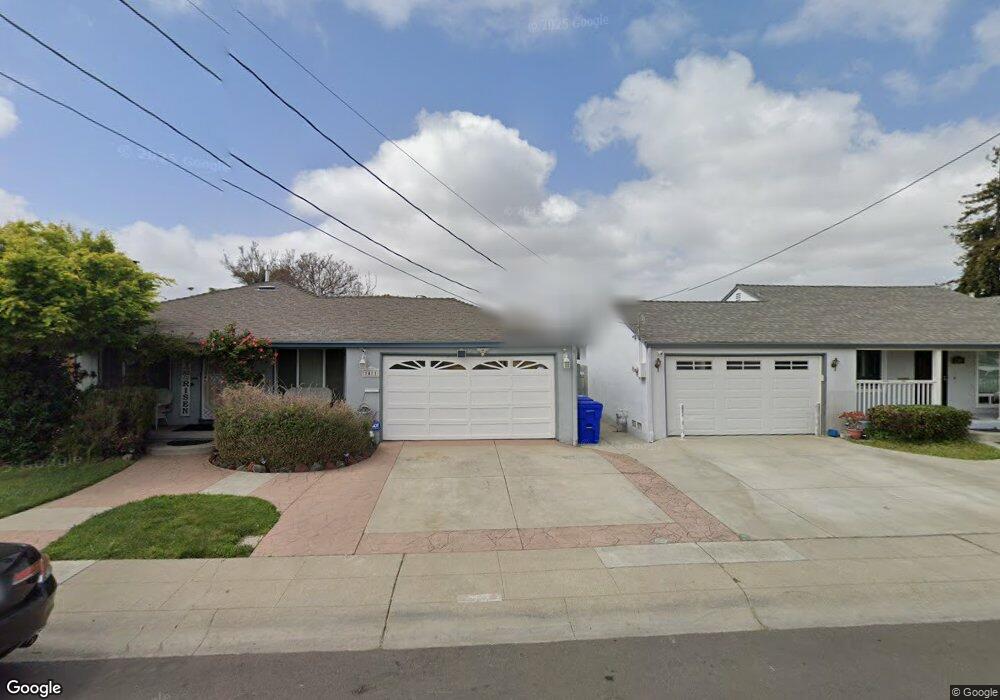
1411 Via Lucas San Lorenzo, CA 94580
Estimated Value: $789,000 - $891,000
3
Beds
1
Bath
1,050
Sq Ft
$789/Sq Ft
Est. Value
About This Home
This home is located at 1411 Via Lucas, San Lorenzo, CA 94580 and is currently estimated at $828,348, approximately $788 per square foot. 1411 Via Lucas is a home located in Alameda County with nearby schools including Bay Elementary School, Bohannon Middle School, and Arroyo High School.
Ownership History
Date
Name
Owned For
Owner Type
Purchase Details
Closed on
Mar 24, 2014
Sold by
Lowrey Victoria L
Bought by
Morales Daniel
Current Estimated Value
Home Financials for this Owner
Home Financials are based on the most recent Mortgage that was taken out on this home.
Original Mortgage
$360,800
Outstanding Balance
$273,057
Interest Rate
4.3%
Mortgage Type
New Conventional
Estimated Equity
$555,291
Purchase Details
Closed on
Jul 14, 2005
Sold by
Lowrey Victoria L
Bought by
Lowrey Victoria L
Purchase Details
Closed on
Jun 9, 2004
Sold by
Krantz William G and Krantz Doris
Bought by
Krantz William G and Krantz Doris
Purchase Details
Closed on
Oct 14, 1995
Sold by
Krantz William G and Krantz Doris
Bought by
Krantz William G and Krantz Doris
Create a Home Valuation Report for This Property
The Home Valuation Report is an in-depth analysis detailing your home's value as well as a comparison with similar homes in the area
Home Values in the Area
Average Home Value in this Area
Purchase History
| Date | Buyer | Sale Price | Title Company |
|---|---|---|---|
| Morales Daniel | $451,000 | North American Title Co Inc | |
| Lowrey Victoria L | -- | -- | |
| Krantz William G | -- | -- | |
| Krantz William G | -- | -- |
Source: Public Records
Mortgage History
| Date | Status | Borrower | Loan Amount |
|---|---|---|---|
| Open | Morales Daniel | $360,800 |
Source: Public Records
Tax History Compared to Growth
Tax History
| Year | Tax Paid | Tax Assessment Tax Assessment Total Assessment is a certain percentage of the fair market value that is determined by local assessors to be the total taxable value of land and additions on the property. | Land | Improvement |
|---|---|---|---|---|
| 2025 | $7,147 | $545,840 | $165,852 | $386,988 |
| 2024 | $7,147 | $535,001 | $162,600 | $379,401 |
| 2023 | $7,111 | $531,377 | $159,413 | $371,964 |
| 2022 | $7,006 | $513,958 | $156,287 | $364,671 |
| 2021 | $6,814 | $503,747 | $153,224 | $357,523 |
| 2020 | $6,668 | $505,511 | $151,653 | $353,858 |
| 2019 | $6,677 | $495,603 | $148,681 | $346,922 |
| 2018 | $6,312 | $485,888 | $145,766 | $340,122 |
| 2017 | $6,023 | $476,363 | $142,909 | $333,454 |
| 2016 | $5,746 | $467,023 | $140,107 | $326,916 |
| 2015 | $5,621 | $460,010 | $138,003 | $322,007 |
| 2014 | $1,046 | $55,002 | $29,401 | $25,601 |
Source: Public Records
Map
Nearby Homes
- 1311 Via Manzanas
- 1575 Via Lucas
- 1608 Keller Ave
- 1338 Via la Paloma
- 17069 Via Chiquita
- 16050 Via Olinda
- 1631 Via Ventana
- 1766 Via Redondo
- 1655 Via Escondido
- 15967 Paseo Del Campo
- 0 E 14th St Unit 41059501
- 17354 Via el Cerrito
- 16011 Via Conejo
- 1867 Via Buena Vista
- 1781 Via Rancho
- 17316 Via Flores
- 17347 Via Encinas
- 15771 Via Nueva
- 18003 Incline Place
- 987 Via Bregani
- 1423 Via Lucas
- 1399 Via Lucas
- 1435 Via Lucas
- 1385 Via Lucas
- 1432 Via San Juan
- 1420 Via San Juan
- 1444 Via San Juan
- 1447 Via Lucas
- 1369 Via Lucas
- 1408 Via San Juan
- 1456 Via San Juan
- 1408 Via Lucas
- 1420 Via Lucas
- 1396 Via Lucas
- 1396 Via San Juan
- 1468 Via San Juan
- 1459 Via Lucas
- 1357 Via Lucas
- 1432 Via Lucas
- 1382 Via Lucas