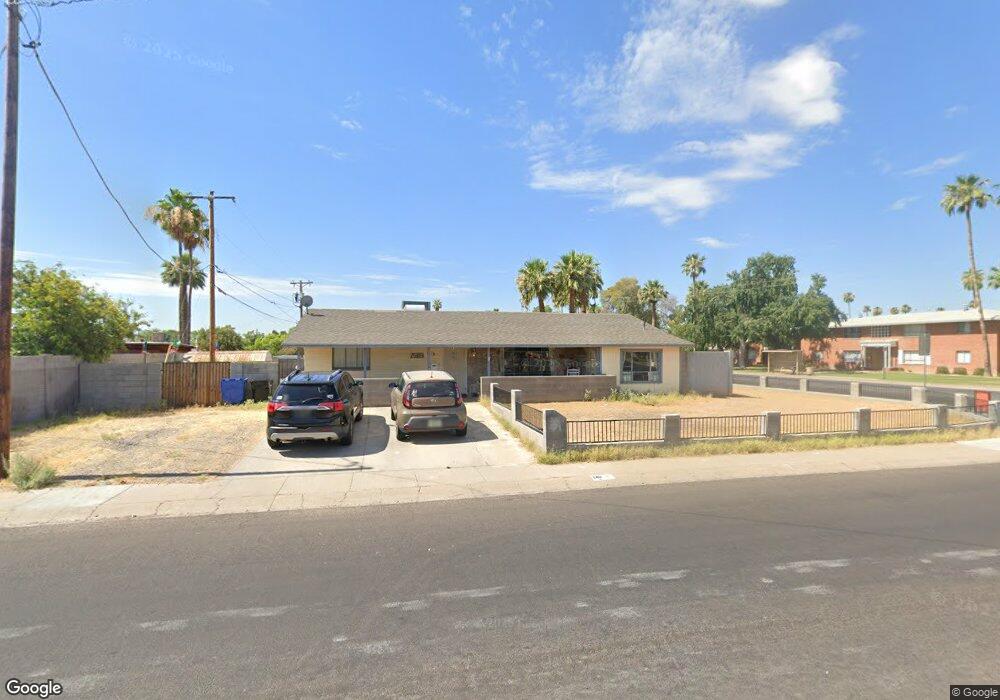
1411 W Highland Ave Phoenix, AZ 85013
Uptown Phoenix NeighborhoodEstimated Value: $378,517 - $482,000
4
Beds
2
Baths
1,420
Sq Ft
$300/Sq Ft
Est. Value
About This Home
This home is located at 1411 W Highland Ave, Phoenix, AZ 85013 and is currently estimated at $425,629, approximately $299 per square foot. 1411 W Highland Ave is a home located in Maricopa County with nearby schools including Clarendon Elementary School, Encanto Elementary School, and Osborn Middle School.
Ownership History
Date
Name
Owned For
Owner Type
Purchase Details
Closed on
Aug 24, 2004
Sold by
Rogel Benjamin
Bought by
Shearer Stephanie L
Current Estimated Value
Home Financials for this Owner
Home Financials are based on the most recent Mortgage that was taken out on this home.
Original Mortgage
$102,320
Interest Rate
5.95%
Mortgage Type
New Conventional
Purchase Details
Closed on
Jun 4, 2001
Sold by
Rodriguez Alberto
Bought by
Rogel Benjamin
Home Financials for this Owner
Home Financials are based on the most recent Mortgage that was taken out on this home.
Original Mortgage
$100,000
Interest Rate
7.14%
Purchase Details
Closed on
Aug 6, 1999
Sold by
Bos Randy and Bos Brenda
Bought by
Rogel Benjamin and Rodriguez Alberto
Create a Home Valuation Report for This Property
The Home Valuation Report is an in-depth analysis detailing your home's value as well as a comparison with similar homes in the area
Home Values in the Area
Average Home Value in this Area
Purchase History
| Date | Buyer | Sale Price | Title Company |
|---|---|---|---|
| Shearer Stephanie L | $127,900 | Fidelity National Title | |
| Rogel Benjamin | -- | Security Title Agency | |
| Rogel Benjamin | $96,000 | Chicago Title Insurance Co |
Source: Public Records
Mortgage History
| Date | Status | Borrower | Loan Amount |
|---|---|---|---|
| Previous Owner | Shearer Stephanie L | $102,320 | |
| Previous Owner | Rogel Benjamin | $100,000 | |
| Closed | Shearer Stephanie L | $25,580 |
Source: Public Records
Tax History Compared to Growth
Tax History
| Year | Tax Paid | Tax Assessment Tax Assessment Total Assessment is a certain percentage of the fair market value that is determined by local assessors to be the total taxable value of land and additions on the property. | Land | Improvement |
|---|---|---|---|---|
| 2025 | $1,497 | $13,106 | -- | -- |
| 2024 | $1,392 | $12,481 | -- | -- |
| 2023 | $1,392 | $32,860 | $6,570 | $26,290 |
| 2022 | $1,386 | $27,800 | $5,560 | $22,240 |
| 2021 | $1,427 | $21,700 | $4,340 | $17,360 |
| 2020 | $1,388 | $21,610 | $4,320 | $17,290 |
| 2019 | $1,323 | $18,420 | $3,680 | $14,740 |
| 2018 | $1,276 | $16,700 | $3,340 | $13,360 |
| 2017 | $1,160 | $17,560 | $3,510 | $14,050 |
| 2016 | $1,117 | $16,860 | $3,370 | $13,490 |
| 2015 | $1,041 | $14,960 | $2,990 | $11,970 |
Source: Public Records
Map
Nearby Homes
- 1214 W Highland Ave
- 4826 N 14th Ave
- 1535 W Hazelwood St Unit 228
- 1314 W Mariposa St
- 4522 N 14th Ave
- 4607 N 12th Ave
- 4537 N 17th Ave Unit 52
- 1657 W Hazelwood St
- 1334 W Sells Dr
- 1527 W Roma Ave
- 729 W Coolidge St Unit 211
- 1119 W Medlock Dr
- 1312 W Roma Ave
- 1704 W Roma Ave
- 5106 N 17th Ave Unit 3
- 4536 N 18th Dr
- 713 W Campbell Ave
- 4401 N 9th Ave
- 4606 N 19th Ave
- 4245 N 16th Dr
- 4645 N 15th Ave
- 4640 N 14th Ave
- 4634 N 14th Ave
- 4641 N 15th Ave
- 4641 N 15th Ave
- 1410 W Highland Ave
- 1410 W Highland Ave Unit 1,2,3
- 4630 N 14th Ave
- 1402 W Highland Ave
- 4637 N 15th Ave
- 4628 N 14th Ave
- 4709 N 15th Ave
- 4641 N 14th Ave
- 1322 W Coolidge St
- 4631 N 15th Ave
- 4708 N 14th Ave
- 4624 N 14th Ave
- 1322 W Highland Ave
- 4711 N 15th Ave Unit 1
- 4711 N 15th Ave Unit 2