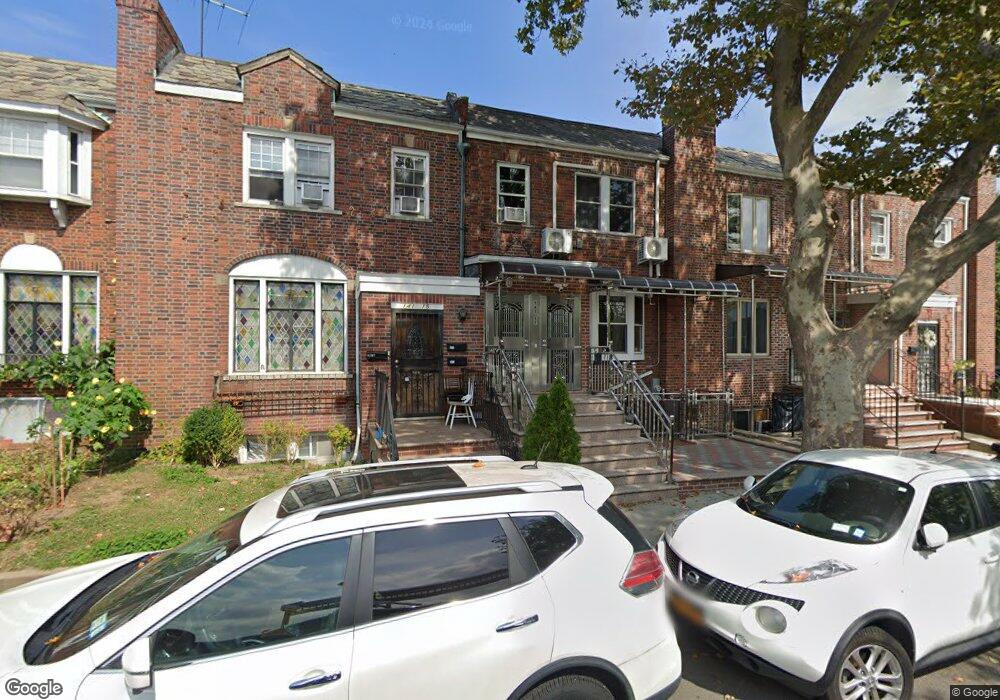
14117 59th Ave Flushing, NY 11355
Queensboro Hill NeighborhoodEstimated Value: $1,082,852 - $1,290,000
Studio
--
Bath
1,756
Sq Ft
$688/Sq Ft
Est. Value
About This Home
This home is located at 14117 59th Ave, Flushing, NY 11355 and is currently estimated at $1,208,713, approximately $688 per square foot. 14117 59th Ave is a home located in Queens County with nearby schools including P.S. 163 - Flushing Heights, Rachel Carson I.S. 237Q, and John Bowne High School.
Ownership History
Date
Name
Owned For
Owner Type
Purchase Details
Closed on
Nov 5, 2021
Sold by
Ohanian Kim
Bought by
Chen Zhi Ying and Lu Yu Hui
Current Estimated Value
Home Financials for this Owner
Home Financials are based on the most recent Mortgage that was taken out on this home.
Original Mortgage
$600,000
Outstanding Balance
$548,663
Interest Rate
3.14%
Mortgage Type
Purchase Money Mortgage
Estimated Equity
$660,050
Purchase Details
Closed on
Feb 15, 1995
Sold by
Ohanian Kim
Bought by
Ohanian Kim and Seropian Renate
Home Financials for this Owner
Home Financials are based on the most recent Mortgage that was taken out on this home.
Original Mortgage
$115,000
Interest Rate
8.96%
Purchase Details
Closed on
Jan 19, 1995
Sold by
Ohanian Eric and Ohanian Dolores
Bought by
Ohanian Kim
Home Financials for this Owner
Home Financials are based on the most recent Mortgage that was taken out on this home.
Original Mortgage
$115,000
Interest Rate
8.96%
Create a Home Valuation Report for This Property
The Home Valuation Report is an in-depth analysis detailing your home's value as well as a comparison with similar homes in the area
Home Values in the Area
Average Home Value in this Area
Purchase History
| Date | Buyer | Sale Price | Title Company |
|---|---|---|---|
| Chen Zhi Ying | $1,100,000 | -- | |
| Chen Zhi Ying | $1,100,000 | -- | |
| Chen Zhi Ying | $1,100,000 | -- | |
| Ohanian Kim | -- | -- | |
| Ohanian Kim | -- | -- | |
| Ohanian Kim | $100,000 | The Title Guarantee Company | |
| Ohanian Kim | $100,000 | The Title Guarantee Company |
Source: Public Records
Mortgage History
| Date | Status | Borrower | Loan Amount |
|---|---|---|---|
| Open | Chen Zhi Ying | $600,000 | |
| Closed | Chen Zhi Ying | $600,000 | |
| Previous Owner | Ohanian Kim | $115,000 |
Source: Public Records
Tax History
| Year | Tax Paid | Tax Assessment Tax Assessment Total Assessment is a certain percentage of the fair market value that is determined by local assessors to be the total taxable value of land and additions on the property. | Land | Improvement |
|---|---|---|---|---|
| 2025 | $10,177 | $53,001 | $7,961 | $45,040 |
| 2024 | $10,177 | $50,671 | $8,045 | $42,626 |
| 2023 | $8,635 | $42,991 | $7,727 | $35,264 |
| 2022 | $7,550 | $56,400 | $10,860 | $45,540 |
| 2021 | $7,352 | $58,440 | $10,860 | $47,580 |
| 2020 | $6,962 | $53,340 | $10,860 | $42,480 |
| 2019 | $6,474 | $58,740 | $10,860 | $47,880 |
| 2018 | $6,296 | $32,347 | $5,932 | $26,415 |
| 2017 | $6,125 | $31,518 | $6,824 | $24,694 |
| 2016 | $5,745 | $31,518 | $6,824 | $24,694 |
| 2015 | $3,366 | $28,573 | $8,021 | $20,552 |
| 2014 | $3,366 | $26,956 | $8,400 | $18,556 |
Source: Public Records
Map
Nearby Homes
- 14017 58th Rd
- 13814 58th Rd
- 5804 Main St Unit 2D
- 61-12 Main St
- 6114 Main St
- 136-43 58th Rd
- 141-11 Booth Memorial Ave
- 146-18 59th Ave
- 141-15 Booth Memorial Ave
- 14234 Booth Memorial Ave
- 142-24 61st Rd
- 13437 58th Rd
- 13620 Booth Memorial Ave Unit 2A
- 148-03 Horace Harding Expy
- 148-10 59th Ave
- 56-75 136th St Unit 3B
- 6307 138th St
- 132-56 60th Ave
- 63-09 138th St
- 14839 60th Ave
- 14115 59th Ave
- 14119 59th Ave
- 14119 59th Ave
- 14119 59th Ave Unit 2 FL
- 14119 59th Ave Unit 2 FL
- 141-15 59th Ave
- 14113 59th Ave
- 14121 59th Ave
- 14111 59th Ave
- 14123 59th Ave
- 14109 59th Ave
- 14107 59th Ave
- 14022 58th Rd
- 14024 58th Rd
- 14020 58th Rd
- 14026 58th Rd
- 141-07 59th Ave
- 14018 58th Rd
- 14028 58th Rd
- 140-24 58th Rd
Your Personal Tour Guide
Ask me questions while you tour the home.