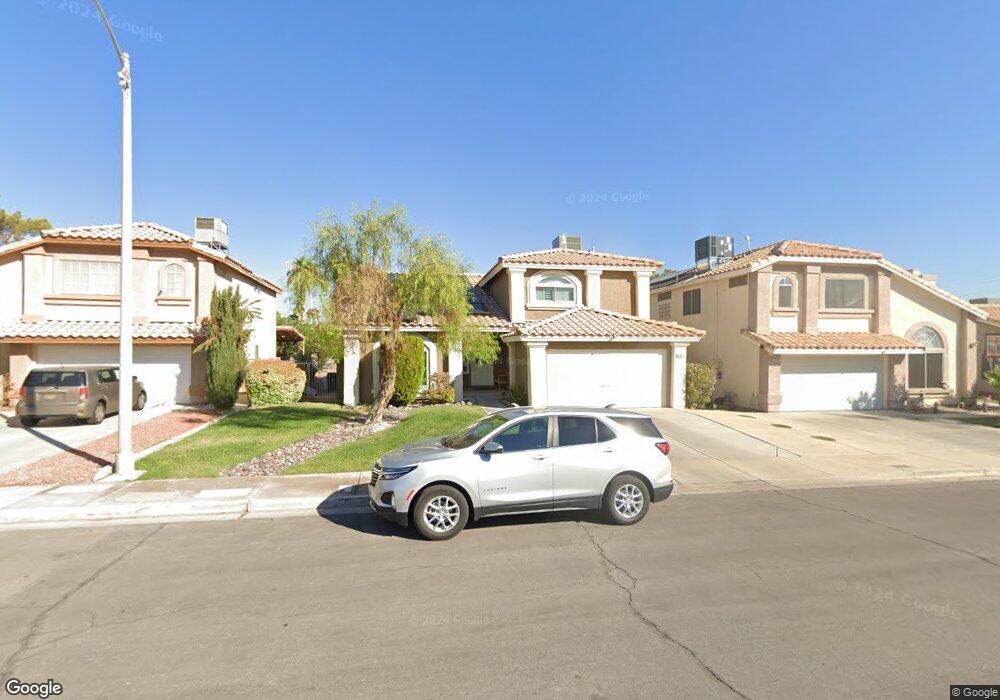
1412 Bareback Ct Unit 5 Henderson, NV 89014
Whitney Ranch NeighborhoodEstimated Value: $452,559 - $498,000
4
Beds
3
Baths
2,134
Sq Ft
$222/Sq Ft
Est. Value
About This Home
This home is located at 1412 Bareback Ct Unit 5, Henderson, NV 89014 and is currently estimated at $473,890, approximately $222 per square foot. 1412 Bareback Ct Unit 5 is a home located in Clark County with nearby schools including Harriet Treem Elementary School, Jim Thorpe Elementary School, and Francis H Cortney Junior High School.
Ownership History
Date
Name
Owned For
Owner Type
Purchase Details
Closed on
Aug 16, 2012
Sold by
Ware Charles E and Villasenor Ware Toni M
Bought by
Villaseanor Ware Toni
Current Estimated Value
Purchase Details
Closed on
Aug 9, 2006
Sold by
Villasenor Ware Toni M and Villasenor Toni
Bought by
Ware Charles E and Villasenor Ware Toni M
Home Financials for this Owner
Home Financials are based on the most recent Mortgage that was taken out on this home.
Original Mortgage
$307,700
Interest Rate
7.75%
Mortgage Type
Unknown
Purchase Details
Closed on
May 24, 2001
Sold by
Zuehlsdorf Robert Edward and Zuehlsdorf Yong Chu
Bought by
Villasenor Toni
Home Financials for this Owner
Home Financials are based on the most recent Mortgage that was taken out on this home.
Original Mortgage
$138,320
Interest Rate
7.15%
Mortgage Type
Balloon
Create a Home Valuation Report for This Property
The Home Valuation Report is an in-depth analysis detailing your home's value as well as a comparison with similar homes in the area
Home Values in the Area
Average Home Value in this Area
Purchase History
| Date | Buyer | Sale Price | Title Company |
|---|---|---|---|
| Villaseanor Ware Toni | -- | None Available | |
| Ware Charles E | -- | Commonwealth Title | |
| Villasenor Toni | $172,900 | Stewart Title |
Source: Public Records
Mortgage History
| Date | Status | Borrower | Loan Amount |
|---|---|---|---|
| Previous Owner | Ware Charles E | $307,700 | |
| Previous Owner | Villasenor Toni | $138,320 | |
| Closed | Villasenor Toni | $34,500 |
Source: Public Records
Tax History
| Year | Tax Paid | Tax Assessment Tax Assessment Total Assessment is a certain percentage of the fair market value that is determined by local assessors to be the total taxable value of land and additions on the property. | Land | Improvement |
|---|---|---|---|---|
| 2026 | $1,838 | $88,127 | $36,050 | $52,077 |
| 2025 | $1,784 | $88,354 | $35,000 | $53,354 |
| 2024 | $1,733 | $88,354 | $35,000 | $53,354 |
| 2023 | $1,733 | $88,774 | $37,450 | $51,324 |
| 2022 | $1,844 | $77,244 | $30,100 | $47,144 |
| 2021 | $1,708 | $70,690 | $25,550 | $45,140 |
| 2020 | $1,583 | $70,638 | $25,550 | $45,088 |
| 2019 | $1,483 | $67,075 | $22,400 | $44,675 |
| 2018 | $1,416 | $62,143 | $19,250 | $42,893 |
| 2017 | $1,762 | $60,782 | $17,150 | $43,632 |
| 2016 | $1,326 | $58,797 | $14,700 | $44,097 |
| 2015 | $1,322 | $52,354 | $10,850 | $41,504 |
| 2014 | $1,281 | $42,914 | $9,800 | $33,114 |
Source: Public Records
Map
Nearby Homes
- 1408 Bareback Ct Unit 5
- 959 Derringer Ln
- 967 Derringer Ln
- 906 Ambusher St
- 970 Flapjack Dr
- 1467 Orange Jubilee Rd
- 821 Long Branch Dr
- 855 N Stephanie St Unit 1721
- 855 N Stephanie St Unit 1115
- 933 Sitting Bull Dr
- 902 Squaw Peak Dr
- 1486 Powder Horn Dr
- 815 Rising Star Dr
- 1536 Pony Ranch Cir
- 1550 Orchard Falls Ct
- 716 Panhandle Dr
- 1550 Mistywood Ct
- 731 Rising Star Dr
- 1633 Blue Cliffs Ave
- 909 Kyanite Ln
- 1410 Bareback Ct
- 1414 Bareback Ct
- 1413 Pathfinder Rd
- 1415 Pathfinder Rd
- 1408 Bareback Ct Unit n
- 1411 Pathfinder Rd
- 1416 Bareback Ct
- 1411 Bareback Ct
- 1417 Pathfinder Rd
- 1413 Bareback Ct
- 1409 Pathfinder Rd Unit 5
- 1409 Bareback Ct
- 1406 Bareback Ct
- 1415 Bareback Ct
- 1407 Bareback Ct
- 1407 Pathfinder Rd
- 1419 Pathfinder Rd
- 961 Derringer Ln
- 963 Derringer Ln
- 1404 Bareback Ct
Your Personal Tour Guide
Ask me questions while you tour the home.