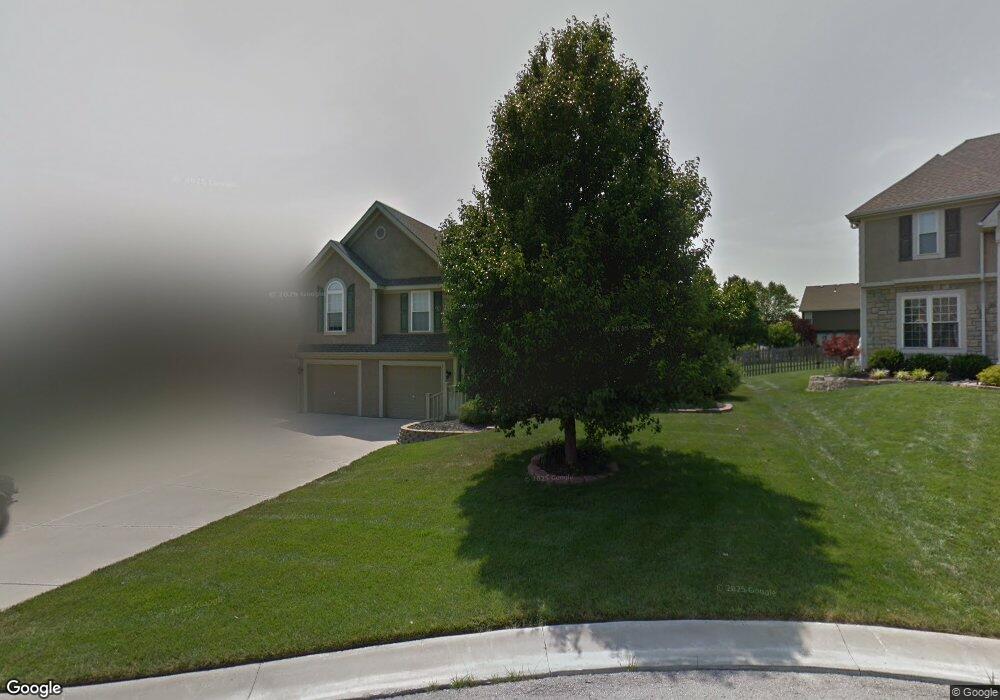
1412 Corey Ln Lansing, KS 66043
Estimated Value: $408,786 - $434,000
4
Beds
3
Baths
1,850
Sq Ft
$229/Sq Ft
Est. Value
About This Home
This home is located at 1412 Corey Ln, Lansing, KS 66043 and is currently estimated at $423,447, approximately $228 per square foot. 1412 Corey Ln is a home located in Leavenworth County with nearby schools including Lansing Elementary School, Lansing Middle 6-8, and Lansing High 9-12.
Ownership History
Date
Name
Owned For
Owner Type
Purchase Details
Closed on
Aug 1, 2002
Bought by
Jones Bruce W and Jones Nereida S
Current Estimated Value
Home Financials for this Owner
Home Financials are based on the most recent Mortgage that was taken out on this home.
Original Mortgage
$234,825
Outstanding Balance
$36,396
Interest Rate
6.34%
Mortgage Type
New Conventional
Estimated Equity
$387,051
Create a Home Valuation Report for This Property
The Home Valuation Report is an in-depth analysis detailing your home's value as well as a comparison with similar homes in the area
Home Values in the Area
Average Home Value in this Area
Purchase History
| Date | Buyer | Sale Price | Title Company |
|---|---|---|---|
| Jones Bruce W | $233,600 | -- |
Source: Public Records
Mortgage History
| Date | Status | Borrower | Loan Amount |
|---|---|---|---|
| Open | Jones Bruce W | $234,825 | |
| Closed | Jones Bruce W | $274,000 |
Source: Public Records
Tax History
| Year | Tax Paid | Tax Assessment Tax Assessment Total Assessment is a certain percentage of the fair market value that is determined by local assessors to be the total taxable value of land and additions on the property. | Land | Improvement |
|---|---|---|---|---|
| 2025 | $6,094 | $46,830 | $6,012 | $40,818 |
| 2024 | $5,643 | $45,029 | $6,012 | $39,017 |
| 2023 | $5,643 | $43,297 | $6,012 | $37,285 |
| 2022 | $5,291 | $38,399 | $5,057 | $33,342 |
| 2021 | $5,334 | $36,973 | $5,057 | $31,916 |
| 2020 | $5,077 | $34,638 | $5,057 | $29,581 |
| 2019 | $5,084 | $34,638 | $5,057 | $29,581 |
| 2018 | $4,918 | $33,534 | $5,057 | $28,477 |
| 2017 | $4,737 | $32,235 | $5,057 | $27,178 |
| 2016 | $4,739 | $32,235 | $5,057 | $27,178 |
| 2015 | $4,607 | $31,441 | $5,057 | $26,384 |
| 2014 | $4,368 | $30,439 | $5,057 | $25,382 |
Source: Public Records
Map
Nearby Homes
- 875 Clearview Dr
- 1322 Rock Creek Ct
- 898 Clearview Dr
- 189 Canyon View Dr
- 111 Southfork Rd
- 1221 S Desoto Rd
- 922 Southfork St
- 811 4-H Rd
- 24431 139th St
- 13965 Mc Intyre Rd
- 13788 McIntyre1 Rd
- 13788 Mcintyre Rd
- 13788 McIntyre2 Rd
- 26731 147th St
- 522 Forestglen Ln
- 202 S Main St
- 15683 Gilman Rd
- 124 S Main St
- 130 Hampton Ct
- 218 E Kay St
- 1414 Corey Ln
- 1410 Corey Ln
- 711 Canyon View Dr
- 709 Canyon View Dr
- 713 Canyon View Dr
- 1416 Corey Ln
- 1408 Corey Ln
- 707 Canyon View Dr
- 1413 Corey Ln
- 1411 Corey Ln
- 703 Canyon View Dr
- 1409 Corey Ln
- 1415 Corey Ln
- 701 Canyon View Dr
- 611 Canyon View Dr
- 609 Canyon View Dr
- 718 Canyon View Dr
- 710 Rock Creek Dr
- 1414 Rock Creek Dr
- 1418 Rock Creek Dr
Your Personal Tour Guide
Ask me questions while you tour the home.