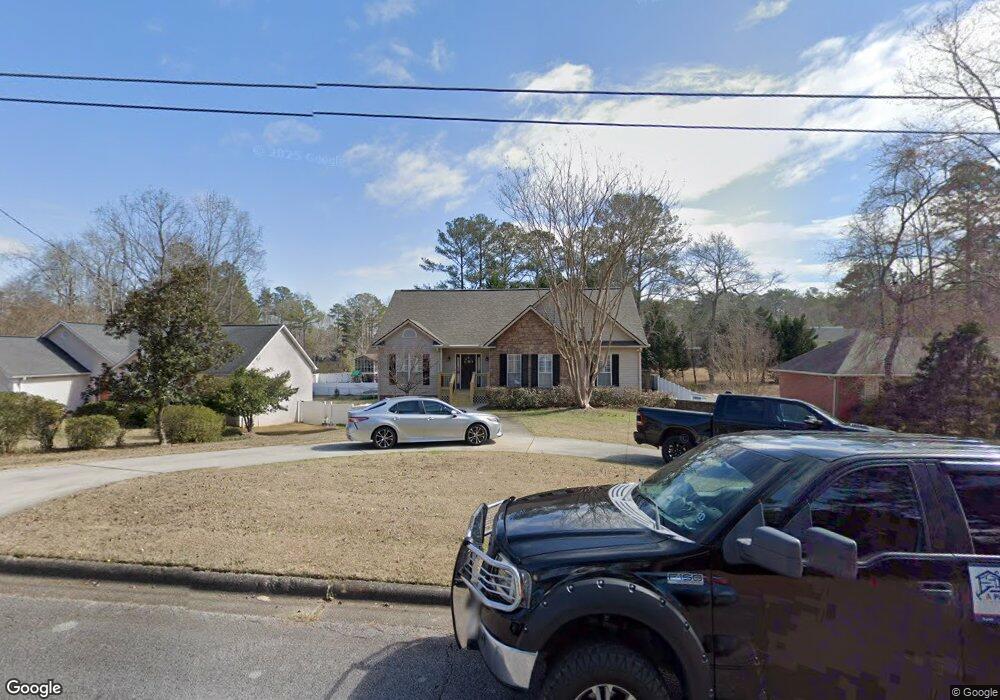
1412 Dauset Dr Griffin, GA 30224
Spalding County NeighborhoodEstimated Value: $240,000 - $261,000
3
Beds
2
Baths
1,519
Sq Ft
$165/Sq Ft
Est. Value
About This Home
This home is located at 1412 Dauset Dr, Griffin, GA 30224 and is currently estimated at $251,106, approximately $165 per square foot. 1412 Dauset Dr is a home located in Spalding County with nearby schools including Crescent Road Elementary School, Rehoboth Road Middle School, and Spalding High School.
Ownership History
Date
Name
Owned For
Owner Type
Purchase Details
Closed on
Nov 6, 1998
Sold by
Inman Jr Richard
Bought by
Pruitt John
Current Estimated Value
Purchase Details
Closed on
Jul 14, 1988
Sold by
Horn Jack V and Horn Eula L
Bought by
Inman Richard Wesley and Inman Kazue
Purchase Details
Closed on
May 6, 1986
Sold by
Mullins Murray G and Mullins Richard L
Bought by
Horn Jack V and Horn Eula L
Purchase Details
Closed on
Jul 9, 1985
Sold by
Daughtry Foundation Inc
Bought by
Mullins Murray G and Mullins Richar
Purchase Details
Closed on
Jan 3, 1985
Sold by
Daughtry H L
Bought by
Daughtry Foundation Inc
Purchase Details
Closed on
Jul 20, 1984
Sold by
Daughtry H L
Bought by
Daughtry H L
Purchase Details
Closed on
Jul 16, 1984
Sold by
Daughtry H L & Trust Co Bank Trustee
Bought by
Daughtry H L
Purchase Details
Closed on
Dec 1, 1978
Sold by
Settle Settle D and Settle Daughtry H
Bought by
Daughtry H L & Trust Co Bank Trustee
Create a Home Valuation Report for This Property
The Home Valuation Report is an in-depth analysis detailing your home's value as well as a comparison with similar homes in the area
Home Values in the Area
Average Home Value in this Area
Purchase History
| Date | Buyer | Sale Price | Title Company |
|---|---|---|---|
| Pruitt John | $10,000 | -- | |
| Inman Richard Wesley | $8,000 | -- | |
| Horn Jack V | $4,000 | -- | |
| Mullins Murray G | $8,500 | -- | |
| Daughtry Foundation Inc | -- | -- | |
| Daughtry H L | -- | -- | |
| Daughtry H L | -- | -- | |
| Daughtry H L & Trust Co Bank Trustee | -- | -- |
Source: Public Records
Tax History
| Year | Tax Paid | Tax Assessment Tax Assessment Total Assessment is a certain percentage of the fair market value that is determined by local assessors to be the total taxable value of land and additions on the property. | Land | Improvement |
|---|---|---|---|---|
| 2025 | $3,398 | $98,244 | $10,000 | $88,244 |
| 2024 | $3,324 | $98,244 | $10,000 | $88,244 |
| 2023 | $3,832 | $98,244 | $10,000 | $88,244 |
| 2022 | $3,312 | $85,231 | $8,000 | $77,231 |
| 2021 | $2,705 | $70,031 | $8,000 | $62,031 |
| 2020 | $2,705 | $70,031 | $8,000 | $62,031 |
| 2019 | $2,239 | $57,364 | $8,000 | $49,364 |
| 2018 | $0 | $53,777 | $8,000 | $45,777 |
| 2017 | $2,107 | $53,357 | $8,000 | $45,357 |
| 2016 | $2,142 | $53,357 | $8,000 | $45,357 |
| 2015 | $2,177 | $53,357 | $8,000 | $45,357 |
| 2014 | $2,242 | $53,357 | $8,000 | $45,357 |
Source: Public Records
Map
Nearby Homes
- 1414 Dauset Dr
- 1407 Rainbow Cir
- 1405 Rainbow Cir
- 1421 Southworth Dr
- 1450 Dauset Dr
- 0 Martin Luther King jr Pkwy Unit 19-41 BYPASS HIGHWAY
- 1232 Buttermilk Ln
- 725 Maddox Rd
- 227 Brown Acres Rd
- 0 Maddox Rd Unit 26607995
- 622 Grandview Dr
- 1104 Coldwater Dr
- 133 Coldwater Ln
- 127 Mckinley Dr
- 1064 Cold Water Dr
- 649 Laura Dr
- 204 Maddox Rd
- 405 Crescent Ct
- 133 Four Oaks Dr
- 1082 Coldwater Dr
- 1410 Dauset Dr
- 1414 Dauset Dr Unit LOT 9,BLOCKC
- 1413 Rainbow Cir
- 1408 Dauset Dr
- 1418 Dauset Dr
- 1411 Rainbow Cir
- 1415 Rainbow Cir
- 1413 Dauset Dr
- 1411 Dauset Dr
- 1415 Dauset Dr
- 1409 Rainbow Cir
- 1417 Rainbow Cir
- 1406 Dauset Dr
- 1422 Dauset Dr
- 1409 Dauset Dr
- 1419 Dauset Dr
- 1419 Rainbow Cir
- 1407 Dauset Dr
- 1404 Dauset Dr
- 1421 Dauset Dr
Your Personal Tour Guide
Ask me questions while you tour the home.