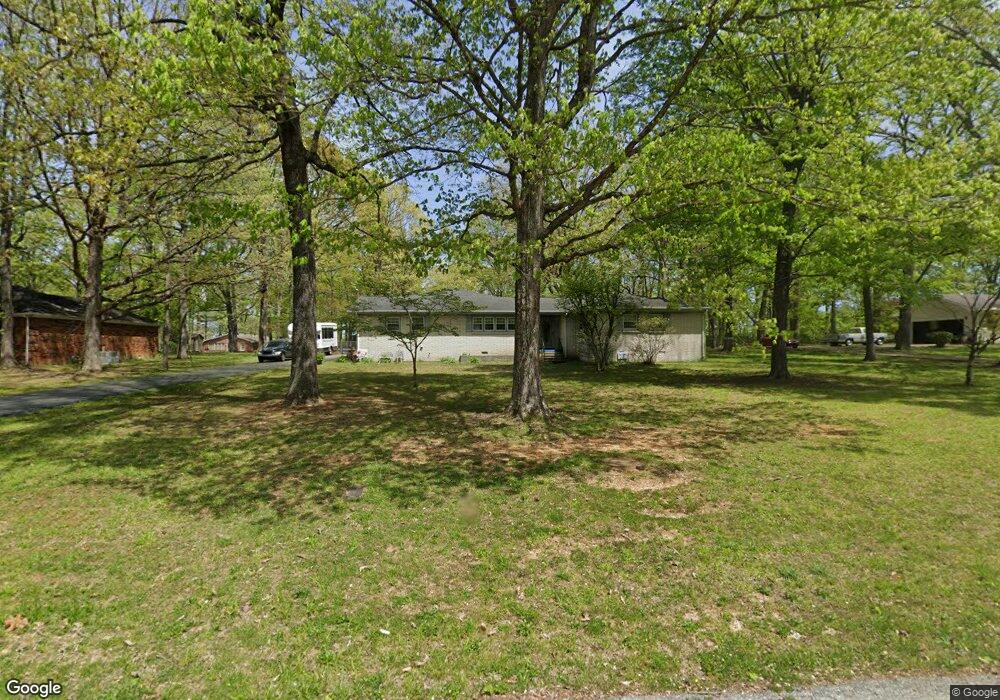
1412 Hillwood Cir Lafayette, TN 37083
Estimated Value: $234,000 - $308,000
--
Bed
2
Baths
1,610
Sq Ft
$160/Sq Ft
Est. Value
About This Home
This home is located at 1412 Hillwood Cir, Lafayette, TN 37083 and is currently estimated at $257,703, approximately $160 per square foot. 1412 Hillwood Cir is a home located in Macon County with nearby schools including Macon Christian Academy.
Ownership History
Date
Name
Owned For
Owner Type
Purchase Details
Closed on
Jul 17, 2023
Sold by
Scott Jessica
Bought by
Scott Joseph A
Current Estimated Value
Home Financials for this Owner
Home Financials are based on the most recent Mortgage that was taken out on this home.
Original Mortgage
$256,410
Outstanding Balance
$249,921
Interest Rate
6.69%
Mortgage Type
FHA
Estimated Equity
$7,782
Purchase Details
Closed on
Jun 16, 2023
Sold by
Scott Joseph A
Bought by
Pack James R and Pack Keli
Home Financials for this Owner
Home Financials are based on the most recent Mortgage that was taken out on this home.
Original Mortgage
$256,410
Outstanding Balance
$249,921
Interest Rate
6.69%
Mortgage Type
FHA
Estimated Equity
$7,782
Purchase Details
Closed on
Oct 9, 1998
Sold by
Duarard June V
Bought by
Newberry Lynn and Newberry Judy
Purchase Details
Closed on
Sep 9, 1996
Sold by
Duarard Richard E
Bought by
Duarard June V
Purchase Details
Closed on
Sep 22, 1980
Bought by
Duarard Richard E and Duarard June V
Create a Home Valuation Report for This Property
The Home Valuation Report is an in-depth analysis detailing your home's value as well as a comparison with similar homes in the area
Home Values in the Area
Average Home Value in this Area
Purchase History
| Date | Buyer | Sale Price | Title Company |
|---|---|---|---|
| Scott Joseph A | -- | Andrew A Stanford Attorney At | |
| Pack James R | $280,000 | City Title Llc | |
| Newberry Lynn | $85,000 | -- | |
| Duarard June V | -- | -- | |
| Duarard Richard E | -- | -- |
Source: Public Records
Mortgage History
| Date | Status | Borrower | Loan Amount |
|---|---|---|---|
| Open | Pack James R | $256,410 |
Source: Public Records
Tax History Compared to Growth
Tax History
| Year | Tax Paid | Tax Assessment Tax Assessment Total Assessment is a certain percentage of the fair market value that is determined by local assessors to be the total taxable value of land and additions on the property. | Land | Improvement |
|---|---|---|---|---|
| 2024 | $961 | $60,425 | $6,250 | $54,175 |
| 2023 | $1,136 | $60,425 | $0 | $0 |
| 2022 | $1,029 | $32,650 | $3,750 | $28,900 |
| 2021 | $1,013 | $32,650 | $3,750 | $28,900 |
| 2020 | $1,013 | $32,650 | $3,750 | $28,900 |
| 2019 | $1,013 | $32,650 | $3,750 | $28,900 |
| 2018 | $936 | $32,650 | $3,750 | $28,900 |
| 2017 | $890 | $27,225 | $3,000 | $24,225 |
| 2016 | $857 | $27,225 | $3,000 | $24,225 |
| 2015 | $858 | $27,225 | $3,000 | $24,225 |
| 2014 | $857 | $27,222 | $0 | $0 |
Source: Public Records
Map
Nearby Homes
- 1403 Flippin Dr
- 1700 Ellington Dr
- 1216 Hollis Ln
- 890 Akersville Rd
- 1212 Hollis Ln
- 1400 Dogwood Ln
- 1305 Scottsville Rd
- 1401 Ellington Dr
- 1305 Ellington Dr
- 1108 Flippin Dr
- 1009 Due West Cir
- 500 Akersville Rd
- 1005 Due Cir W
- 79 Taylor Ln
- 315 Froedge Dr
- 641 Coolidge Rd
- 73 Hayden Drake Ln
- 106 Mai Ridge Ln
- 120 Mai Ridge Ln
- 195 Froedge Dr
- 1408 Hillwood Cir
- 1600 Ellington Dr
- 1416 Hillwood Cir
- 1413 Flippin Dr
- 1407 Hillwood Cir
- 1411 Flippin Dr
- 1405 Hillwood Cir
- 1 Ellington Dr
- 1602 Ellington Dr
- 1403 Hillwood Cir
- 1409 Hillwood Cir
- 1409 Flippin Dr
- 1404 N Hollis Ln
- 1500 Hillwood Cir
- 1407 Flippin Dr
- 1404 Hillwood Cir
- 1502 Hillwood Cir
- 1601 Ellington Dr
- 1604 Ellington Dr
- 1410 Flippin Dr