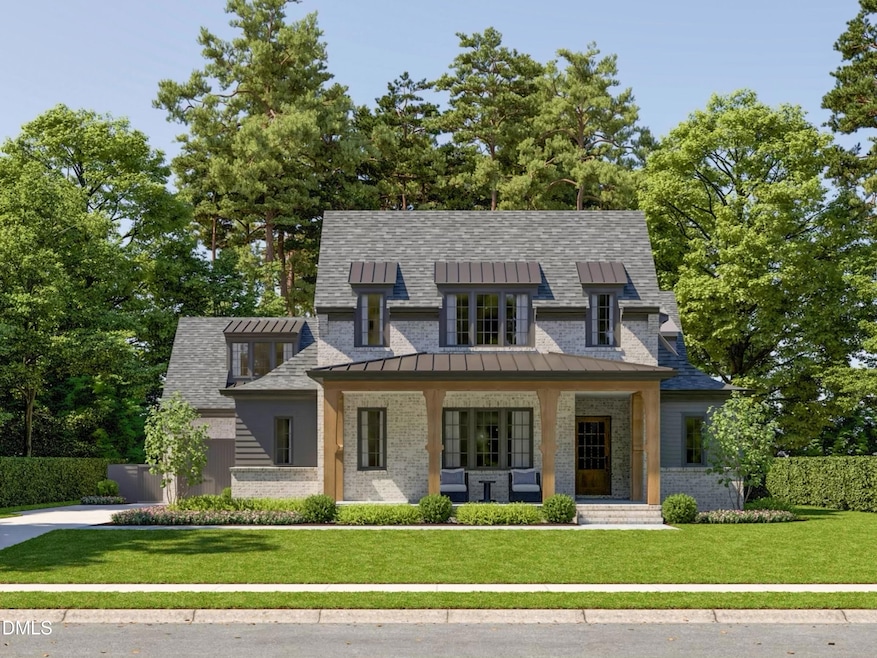
1412 Pony Run Rd Raleigh, NC 27615
North Ridge NeighborhoodEstimated payment $19,952/month
Highlights
- Golf Course Community
- Fitness Center
- Remodeled in 2026
- West Millbrook Middle School Rated A-
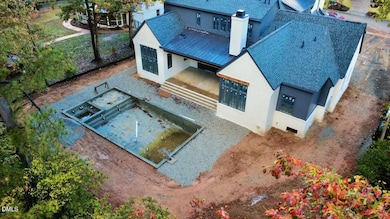
- Heated Pool and Spa
- View of Trees or Woods
About This Home
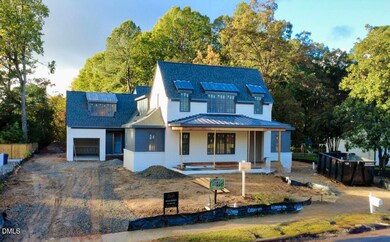
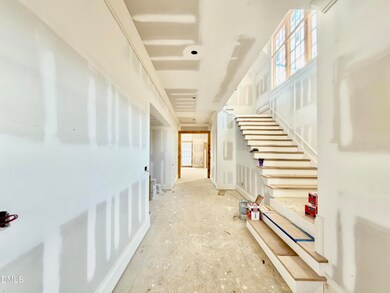
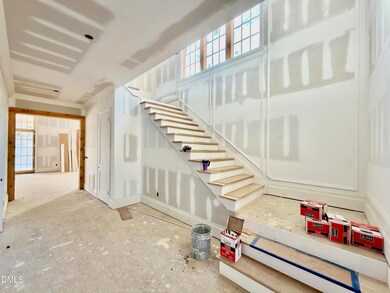
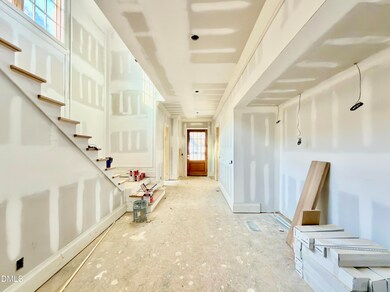
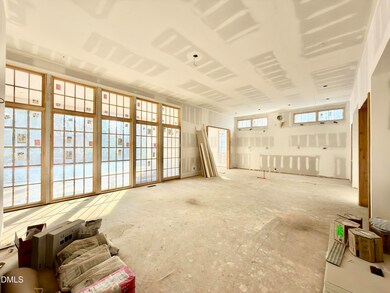
Luxury and craftsmanship define this stunning custom-built residence located in the prestigious North Ridge Country Club community. Expertly crafted by DJF Builders and designed by Frazier Home Design, this residence showcases timeless architecture, thoughtful design, and top-of-the-line finishes throughout. The open, elegant floor plan is ideal for modern living and entertaining. The gourmet kitchen features Thermador appliances, custom cabinetry, and a spacious scullery. Expansive living and dining areas seamlessly connect to the screened porch, which overlooks the resort-style pool and spa. A convenient pool bath enhances the home's outdoor living experience. The first-floor primary suite offers a luxurious retreat with a spa-inspired bath and generous walk-in closets. A first-floor guest suite provides privacy and comfort for visitors, while upstairs, you'll find additional bedrooms, a game room, and a second laundry room for added convenience. Additional highlights include a conditioned wine display, dedicated study, three-car garage, and dual laundry rooms. Every detail has been thoughtfully selected to create a perfect blend of comfort, sophistication, and style. Located just minutes from world-class amenities, fine dining, and premier shopping, this exceptional home delivers the ultimate in luxury living within one of Raleigh's most desirable communities.
Home Details
Home Type
- Single Family
Est. Annual Taxes
- $6,890
Year Built
- Remodeled in 2026
Lot Details
- 0.39 Acre Lot
- Rectangular Lot
- Level Lot
- Front and Back Yard Sprinklers
- Landscaped with Trees
- Back Yard Fenced and Front Yard
- Property is zoned R-6
Parking
- 3 Car Attached Garage
- Parking Pad
- Side Facing Garage
- Garage Door Opener
- Private Driveway
- 3 Open Parking Spaces
Property Views
- Woods
- Neighborhood
Home Design
- Home is estimated to be completed on 4/30/26
- Transitional Architecture
- Traditional Architecture
- Arts and Crafts Architecture
- Brick Veneer
- Permanent Foundation
- Frame Construction
- Architectural Shingle Roof
- Metal Roof
Interior Spaces
- 5,407 Sq Ft Home
- 2-Story Property
- Open Floorplan
- Wet Bar
- Wired For Sound
- Wired For Data
- Built-In Features
- Crown Molding
- Coffered Ceiling
- Smooth Ceilings
- Cathedral Ceiling
- Ceiling Fan
- Recessed Lighting
- Chandelier
- Gas Log Fireplace
- Fireplace Features Masonry
- Low Emissivity Windows
- French Doors
- Entrance Foyer
- Family Room with Fireplace
- 2 Fireplaces
- Combination Kitchen and Dining Room
- Home Office
- Bonus Room
- Crawl Space
Kitchen
- Eat-In Kitchen
- Breakfast Bar
- Butlers Pantry
- Double Convection Oven
- Built-In Gas Range
- Range Hood
- Microwave
- Built-In Freezer
- Built-In Refrigerator
- Ice Maker
- Dishwasher
- Wine Cooler
- Stainless Steel Appliances
- Kitchen Island
- Quartz Countertops
- Disposal
Flooring
- Wood
- Carpet
- Ceramic Tile
Bedrooms and Bathrooms
- 5 Bedrooms | 2 Main Level Bedrooms
- Primary Bedroom on Main
- Walk-In Closet
- In-Law or Guest Suite
- Double Vanity
- Private Water Closet
- Separate Shower in Primary Bathroom
- Soaking Tub
- Bathtub with Shower
- Separate Shower
Laundry
- Laundry Room
- Laundry in multiple locations
- Sink Near Laundry
- Washer and Electric Dryer Hookup
Attic
- Attic Floors
- Scuttle Attic Hole
- Pull Down Stairs to Attic
Home Security
- Smart Thermostat
- Carbon Monoxide Detectors
- Fire and Smoke Detector
Eco-Friendly Details
- Energy-Efficient HVAC
- Energy-Efficient Lighting
- Energy-Efficient Thermostat
- Smart Irrigation
Pool
- Heated Pool and Spa
- Filtered Pool
- Heated In Ground Pool
- Heated Spa
- In Ground Spa
- Gunite Pool
- Outdoor Pool
- Saltwater Pool
- Gunite Spa
Outdoor Features
- Covered Patio or Porch
- Outdoor Fireplace
- Outdoor Kitchen
- Exterior Lighting
- Outdoor Storage
- Built-In Barbecue
- Rain Gutters
Location
- Suburban Location
Schools
- North Ridge Elementary School
- West Millbrook Middle School
- Millbrook High School
Utilities
- Forced Air Zoned Heating and Cooling System
- Heating System Uses Natural Gas
- Heat Pump System
- Vented Exhaust Fan
- Underground Utilities
- Natural Gas Connected
- Tankless Water Heater
- Gas Water Heater
- No Septic System
- Phone Available
- Cable TV Available
Listing and Financial Details
- Assessor Parcel Number 1717421308
Community Details
Overview
- No Home Owners Association
- Built by DJF Builders, Inc
- North Ridge Subdivision
- Community Lake
Amenities
- Clubhouse
Recreation
- Golf Course Community
- Tennis Courts
- Racquetball
- Community Playground
- Fitness Center
- Community Pool
- Park
Map
Home Values in the Area
Average Home Value in this Area
Tax History
| Year | Tax Paid | Tax Assessment Tax Assessment Total Assessment is a certain percentage of the fair market value that is determined by local assessors to be the total taxable value of land and additions on the property. | Land | Improvement |
|---|---|---|---|---|
| 2025 | $6,890 | $600,000 | $600,000 | -- |
| 2024 | $6,862 | $787,773 | $600,000 | $187,773 |
| 2023 | $5,870 | $536,722 | $385,000 | $151,722 |
| 2022 | $5,454 | $536,722 | $385,000 | $151,722 |
| 2021 | $5,242 | $536,722 | $385,000 | $151,722 |
| 2020 | $5,147 | $536,722 | $385,000 | $151,722 |
| 2019 | $5,223 | $448,989 | $174,000 | $274,989 |
| 2018 | $4,926 | $448,989 | $174,000 | $274,989 |
| 2017 | $4,691 | $448,989 | $174,000 | $274,989 |
| 2016 | $4,594 | $448,989 | $174,000 | $274,989 |
| 2015 | $4,509 | $433,506 | $165,300 | $268,206 |
| 2014 | $4,276 | $433,506 | $165,300 | $268,206 |
Property History
| Date | Event | Price | List to Sale | Price per Sq Ft |
|---|---|---|---|---|
| 11/04/2025 11/04/25 | For Sale | $3,695,000 | -- | $683 / Sq Ft |
Purchase History
| Date | Type | Sale Price | Title Company |
|---|---|---|---|
| Warranty Deed | $780,000 | None Listed On Document | |
| Warranty Deed | $780,000 | None Listed On Document | |
| Warranty Deed | $780,000 | None Listed On Document | |
| Deed | $187,000 | -- |
Mortgage History
| Date | Status | Loan Amount | Loan Type |
|---|---|---|---|
| Closed | $100,000 | No Value Available | |
| Open | $1,825,000 | Construction | |
| Previous Owner | $581,250 | Credit Line Revolving |
Source: Doorify MLS
MLS Number: 10131307
APN: 1717.18-42-1308-000
Disclaimer: Certain information contained herein is derived from information provided by parties other than Homes.com. All information provided is deemed reliable, but is not guaranteed to be accurate and should be independently verified.
![]() Some IDX listings have been excluded from this IDX display. Brokers make an effort to deliver accurate information, but buyers should independently verify any information on which they will rely in a transaction. The listing broker shall not be responsible for any typographical errors, misinformation, or misprints, and they shall be held totally harmless from any damages arising from reliance upon this data. This data is provided exclusively for consumers’ personal, non-commercial use. Listings marked with an icon are provided courtesy of the Doorify MLS, Inc. of North Carolina, Internet Data Exchange Database. Closed (sold) listings may have been listed and/or sold by a real estate firm other than the firm(s) featured on this website. Closed data is not available until the sale of the property is recorded in the MLS. Home sale data is not an appraisal, CMA, competitive or comparative market analysis, or home valuation of any property. Copyright 2025 Doorify MLS, Inc. of North Carolina. All rights reserved.
Some IDX listings have been excluded from this IDX display. Brokers make an effort to deliver accurate information, but buyers should independently verify any information on which they will rely in a transaction. The listing broker shall not be responsible for any typographical errors, misinformation, or misprints, and they shall be held totally harmless from any damages arising from reliance upon this data. This data is provided exclusively for consumers’ personal, non-commercial use. Listings marked with an icon are provided courtesy of the Doorify MLS, Inc. of North Carolina, Internet Data Exchange Database. Closed (sold) listings may have been listed and/or sold by a real estate firm other than the firm(s) featured on this website. Closed data is not available until the sale of the property is recorded in the MLS. Home sale data is not an appraisal, CMA, competitive or comparative market analysis, or home valuation of any property. Copyright 2025 Doorify MLS, Inc. of North Carolina. All rights reserved.
- 1217 Briar Patch Ln
- 1209 Briar Patch Ln
- 6312 New Market Way
- 1401 Spring Forest Rd
- 6504 Jade Tree Ln
- 6379 New Market Way
- 6541 Tealbriar Dr
- 6423 New Market Way Unit 6423
- 1700 Pony Run Rd
- 6832 Greystone Dr
- 6844 Greystone Dr
- 1516 Hemphill Dr
- 1208 Barcroft Place
- 7000 N Ridge Dr
- 1725 Briarforest Place
- 1216 Barcroft Place
- 1208 Hunting Ridge Rd
- 7050 Sandy Forks Rd Unit 101
- 1524 Edgeside Ct
- 7010 Sandy Forks Rd Unit 103
- 6844 Greystone Dr
- 1437 Greenside Dr
- 5927 Sentinel Dr
- 1001 Fox Hunt Ln
- 700 Spring Falls Dr
- 5813 Nottoway Ct Unit C
- 6625 Lake Hill Dr
- 1220 Manassas Ct Unit B
- 1208 Manassas Ct Unit A
- 6301 Lakecrest Dr
- 6301 Dowd Forest Dr
- 6317 Shanda Dr
- 505 Westbrook Dr
- 2525 Pavilion Place
- 7516 Grist Mill Rd
- 5817 Shady Grove Cir
- 405 Thyme Place
- 7100 Claxton Cir
- 2038 Quail Forest Dr
- 5155 Windy Hill Dr Unit 202
