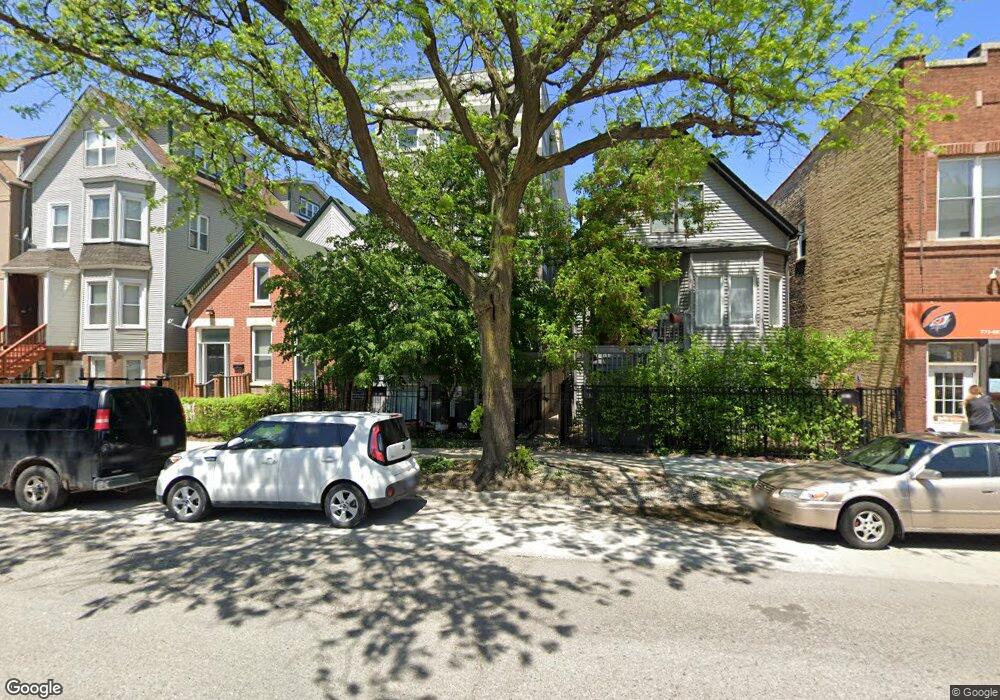
1412 W Diversey Pkwy Unit A Chicago, IL 60614
Southport Corridor NeighborhoodEstimated Value: $862,000 - $992,000
3
Beds
3
Baths
2,400
Sq Ft
$380/Sq Ft
Est. Value
About This Home
This home is located at 1412 W Diversey Pkwy Unit A, Chicago, IL 60614 and is currently estimated at $911,922, approximately $379 per square foot. 1412 W Diversey Pkwy Unit A is a home located in Cook County with nearby schools including Prescott Elementary School, Lincoln Park High School, and Alphonsus Academy & Center For The Arts.
Ownership History
Date
Name
Owned For
Owner Type
Purchase Details
Closed on
Dec 17, 2009
Sold by
Busch Kenneth
Bought by
Ketelhut Joyce Jill and Joyce Jill Ketelhut Revocable Trust
Current Estimated Value
Purchase Details
Closed on
Aug 11, 2009
Sold by
Ketelhut Joyce J
Bought by
Busch Kenneth G and The Joyce Jill Ketelhut Revocable Trust
Purchase Details
Closed on
Jul 8, 1999
Sold by
Ashzoue Partnership Ii
Bought by
Ketelhut Joyce
Create a Home Valuation Report for This Property
The Home Valuation Report is an in-depth analysis detailing your home's value as well as a comparison with similar homes in the area
Home Values in the Area
Average Home Value in this Area
Purchase History
| Date | Buyer | Sale Price | Title Company |
|---|---|---|---|
| Ketelhut Joyce Jill | -- | First American Title Ins Co | |
| Busch Kenneth G | -- | First American Title Ins Co | |
| Ketelhut Joyce | $302,000 | -- |
Source: Public Records
Tax History Compared to Growth
Tax History
| Year | Tax Paid | Tax Assessment Tax Assessment Total Assessment is a certain percentage of the fair market value that is determined by local assessors to be the total taxable value of land and additions on the property. | Land | Improvement |
|---|---|---|---|---|
| 2024 | $12,448 | $65,117 | $26,784 | $38,333 |
| 2023 | $12,135 | $59,000 | $21,600 | $37,400 |
| 2022 | $12,135 | $59,000 | $21,600 | $37,400 |
| 2021 | $11,864 | $58,999 | $21,600 | $37,399 |
| 2020 | $14,085 | $63,227 | $8,640 | $54,587 |
| 2019 | $13,853 | $68,951 | $8,640 | $60,311 |
| 2018 | $13,620 | $68,951 | $8,640 | $60,311 |
| 2017 | $12,914 | $59,988 | $7,776 | $52,212 |
| 2016 | $12,015 | $59,988 | $7,776 | $52,212 |
| 2015 | $10,993 | $59,988 | $7,776 | $52,212 |
| 2014 | $8,045 | $43,360 | $6,336 | $37,024 |
| 2013 | $7,886 | $43,360 | $6,336 | $37,024 |
Source: Public Records
Map
Nearby Homes
- 1350 W Diversey Pkwy Unit 1
- 1437 W Diversey Pkwy Unit 1E
- 2841 N Southport Ave Unit 2
- 2722 N Southport Ave Unit A
- 2743 N Wayne Ave Unit 2753C
- 1309 W Diversey Pkwy
- 1325 W George St Unit 1
- 1522 W Wolfram St
- 2923 N Southport Ave Unit 3
- 2923 N Southport Ave Unit 4
- 2835 N Lakewood Ave Unit P10P19
- 2720 N Greenview Ave Unit L
- 2958 N Lincoln Ave Unit 3A
- 2840 N Lincoln Ave Unit D
- 2851 N Ashland Ave Unit 1S
- 2730 N Magnolia Ave Unit 32
- 1531 W Oakdale Ave Unit 1
- 1329 W Wellington Ave
- 2735 N Magnolia Ave
- 2625 N Wayne Ave
- 1412 W Diversey Pkwy Unit B
- 1412 W Diversey Pkwy Unit B
- 1412 W Diversey Pkwy
- 1412 W Diversey Pkwy
- 1410 W Diversey Pkwy
- 1416 W Diversey Pkwy
- 1408 W Diversey Pkwy
- 1418 W Diversey Pkwy
- 1420 W Diversey Pkwy
- 1420 W Diversey Pkwy Unit 2
- 1422 W Diversey Pkwy
- 1422 W Diversey Pkwy Unit 1
- 1422 W Diversey Pkwy Unit 2
- 1424 W Diversey Pkwy
- 1424 W Diversey Pkwy Unit 2
- 1424 W Diversey Pkwy Unit 1
- 1424 W Diversey Pkwy
- 1417 W Wolfram St
- 1428 W Diversey Pkwy Unit 1
- 1428 W Diversey Pkwy