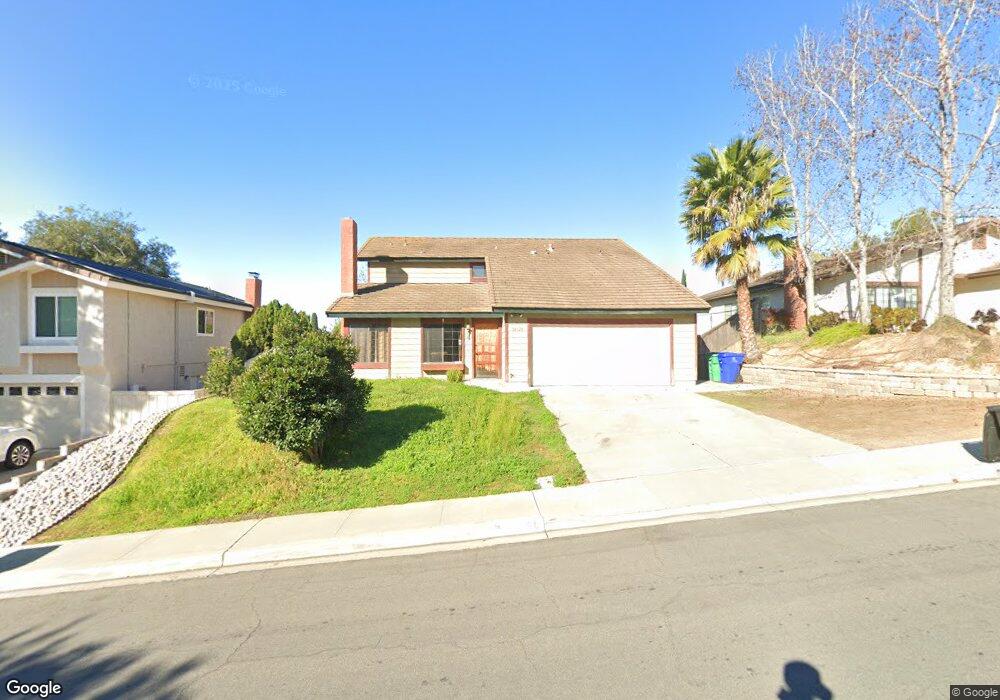
14120 Barrymore St San Diego, CA 92129
Rancho Peñasquitos NeighborhoodEstimated Value: $1,419,998 - $1,518,000
5
Beds
3
Baths
1,962
Sq Ft
$745/Sq Ft
Est. Value
About This Home
This home is located at 14120 Barrymore St, San Diego, CA 92129 and is currently estimated at $1,461,750, approximately $745 per square foot. 14120 Barrymore St is a home located in San Diego County with nearby schools including Adobe Bluffs Elementary School, Black Mountain Middle School, and Mt. Carmel High School.
Ownership History
Date
Name
Owned For
Owner Type
Purchase Details
Closed on
Jul 13, 2015
Sold by
Kolb Steven and Kolb Andrea
Bought by
Kolb Steven and Kolb Andrea
Current Estimated Value
Home Financials for this Owner
Home Financials are based on the most recent Mortgage that was taken out on this home.
Original Mortgage
$410,600
Outstanding Balance
$320,050
Interest Rate
3.85%
Mortgage Type
New Conventional
Estimated Equity
$1,141,700
Purchase Details
Closed on
Jun 3, 1997
Sold by
Perez and Estela
Bought by
Kolb Steve and Kolb Andrea
Home Financials for this Owner
Home Financials are based on the most recent Mortgage that was taken out on this home.
Original Mortgage
$79,577
Interest Rate
7.94%
Mortgage Type
Seller Take Back
Purchase Details
Closed on
Jan 18, 1991
Purchase Details
Closed on
Mar 27, 1985
Create a Home Valuation Report for This Property
The Home Valuation Report is an in-depth analysis detailing your home's value as well as a comparison with similar homes in the area
Home Values in the Area
Average Home Value in this Area
Purchase History
| Date | Buyer | Sale Price | Title Company |
|---|---|---|---|
| Kolb Steven | -- | Western Resources Title | |
| Kolb Steve | -- | -- | |
| -- | $215,000 | -- | |
| -- | $141,000 | -- |
Source: Public Records
Mortgage History
| Date | Status | Borrower | Loan Amount |
|---|---|---|---|
| Open | Kolb Steven | $410,600 | |
| Closed | Kolb Steve | $79,577 |
Source: Public Records
Tax History Compared to Growth
Tax History
| Year | Tax Paid | Tax Assessment Tax Assessment Total Assessment is a certain percentage of the fair market value that is determined by local assessors to be the total taxable value of land and additions on the property. | Land | Improvement |
|---|---|---|---|---|
| 2025 | $4,743 | $431,578 | $130,282 | $301,296 |
| 2024 | $4,743 | $423,117 | $127,728 | $295,389 |
| 2023 | $4,640 | $414,822 | $125,224 | $289,598 |
| 2022 | $4,560 | $406,689 | $122,769 | $283,920 |
| 2021 | $4,498 | $398,715 | $120,362 | $278,353 |
| 2020 | $4,437 | $394,627 | $119,128 | $275,499 |
| 2019 | $4,320 | $386,891 | $116,793 | $270,098 |
| 2018 | $4,197 | $379,305 | $114,503 | $264,802 |
| 2017 | $83 | $371,868 | $112,258 | $259,610 |
| 2016 | $3,998 | $364,577 | $110,057 | $254,520 |
| 2015 | $3,937 | $359,101 | $108,404 | $250,697 |
| 2014 | $3,844 | $352,068 | $106,281 | $245,787 |
Source: Public Records
Map
Nearby Homes
- 8862 La Cartera St
- 9120 Meadowrun Place
- 13907 Bruyere Ct
- 14305 El Vestido St
- 9360 Stargaze Ave
- 14442 Calle Nublado
- 8730 Twin Trails Dr
- 9151 Emden Rd
- 13559 Chaco Ct
- 8183 Doug Hill
- 7795 Sendero Angelica
- 13445 Appalachian Way
- 8114 Sendero de La Pradera
- 13411 Appalachian Way
- 13640 Via Cima Bella
- 13146 Thunderhead St
- 9555 Via Pereza
- 13856 Paseo Cardiel
- 13879 Paseo Cardiel
- 9858 Via Caceres
- 14130 Barrymore St
- 14110 Barrymore St
- 8996 Gainsborough Ave
- 14140 Barrymore St
- 8988 Gainsborough Ave
- 14121 Barrymore St
- 14131 Barrymore St
- 14111 Barrymore St
- 14150 Barrymore St
- 8987 Adobe Bluffs Dr
- 14094 Barrymore St
- 14141 Barrymore St
- 8999 Adobe Bluffs Dr
- 8976 Gainsborough Ave
- 8997 Gainsborough Ave
- 14151 Barrymore St
- 14160 Barrymore St
- 14084 Barrymore St
- 8989 Gainsborough Ave
- 9030 Gainsborough Ave