1413 Bush St Red Wing, MN 55066
Estimated Value: $130,000 - $220,000
3
Beds
1
Bath
1,151
Sq Ft
$162/Sq Ft
Est. Value
About This Home
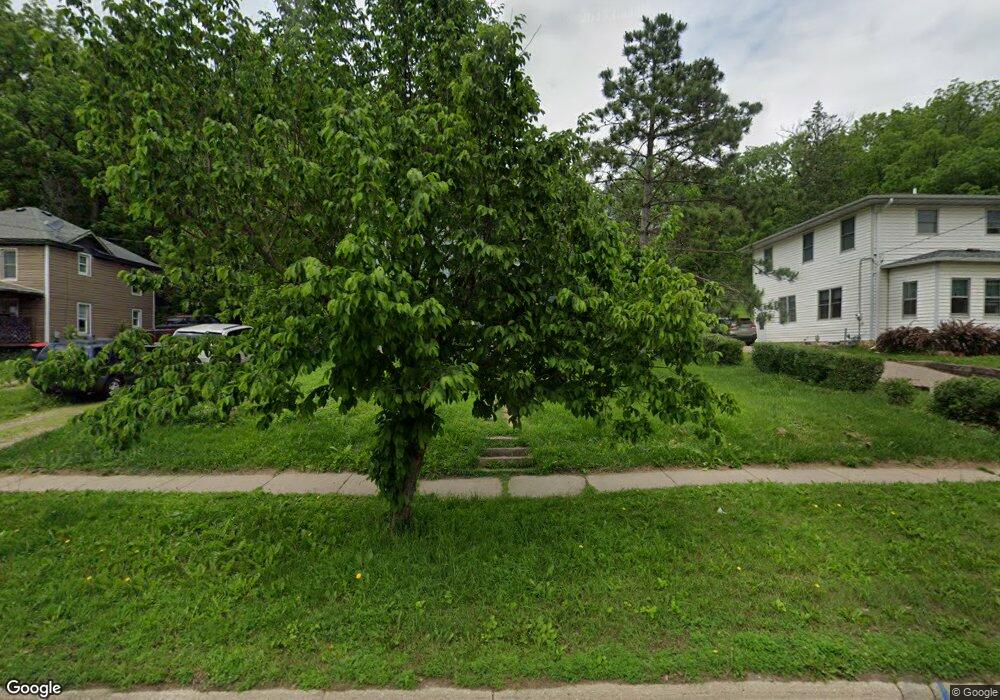
This home is located at 1413 Bush St, Red Wing, MN 55066 and is currently estimated at $186,630, approximately $162 per square foot. 1413 Bush St is a home located in Goodhue County with nearby schools including Sunnyside Elementary School, Burnside Elementary School, and Twin Bluff Middle School.
Ownership History
Date
Name
Owned For
Owner Type
Purchase Details
Closed on
May 10, 2016
Sold by
Saewyc Elizabeth and Saewyc Wayne
Bought by
Field Ryan
Current Estimated Value
Purchase Details
Closed on
Jul 22, 2004
Sold by
Saewyc Elizabeth M
Bought by
Field Ryan M
Home Financials for this Owner
Home Financials are based on the most recent Mortgage that was taken out on this home.
Original Mortgage
$48,000
Interest Rate
6.08%
Mortgage Type
Land Contract Argmt. Of Sale
Purchase Details
Closed on
Jun 30, 1987
Sold by
Howe Paul and Cromer Diane
Bought by
Saewyc Elizabeth M and Carlson Peter J
Create a Home Valuation Report for This Property
The Home Valuation Report is an in-depth analysis detailing your home's value as well as a comparison with similar homes in the area
Home Values in the Area
Average Home Value in this Area
Purchase History
| Date | Buyer | Sale Price | Title Company |
|---|---|---|---|
| Field Ryan | $48,152 | None Available | |
| Field Ryan M | $48,000 | -- | |
| Saewyc Elizabeth M | $30,000 | -- |
Source: Public Records
Mortgage History
| Date | Status | Borrower | Loan Amount |
|---|---|---|---|
| Previous Owner | Field Ryan M | $48,000 |
Source: Public Records
Tax History Compared to Growth
Tax History
| Year | Tax Paid | Tax Assessment Tax Assessment Total Assessment is a certain percentage of the fair market value that is determined by local assessors to be the total taxable value of land and additions on the property. | Land | Improvement |
|---|---|---|---|---|
| 2025 | $1,654 | $123,600 | $47,600 | $76,000 |
| 2024 | -- | $122,100 | $47,600 | $74,500 |
| 2023 | $1,270 | $116,900 | $47,600 | $69,300 |
| 2022 | $1,112 | $116,400 | $47,600 | $68,800 |
| 2021 | $1,034 | $98,400 | $41,900 | $56,500 |
| 2020 | $1,034 | $94,100 | $41,900 | $52,200 |
| 2019 | $960 | $89,300 | $41,900 | $47,400 |
| 2018 | $756 | $85,700 | $38,100 | $47,600 |
| 2017 | $736 | $78,100 | $38,100 | $40,000 |
| 2016 | $676 | $77,400 | $38,100 | $39,300 |
| 2015 | $668 | $75,400 | $38,100 | $37,300 |
| 2014 | -- | $72,300 | $38,100 | $34,200 |
Source: Public Records
Map
Nearby Homes