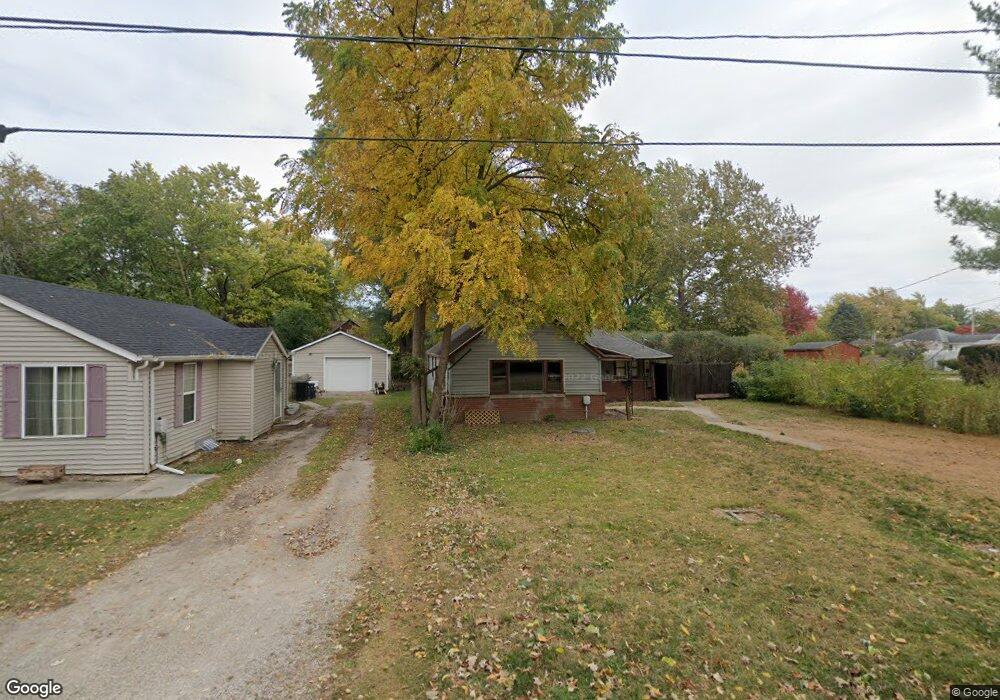
1413 Cleveland Ave Streator, IL 61364
Estimated Value: $39,520 - $129,000
3
Beds
1
Bath
1,328
Sq Ft
$64/Sq Ft
Est. Value
About This Home
This home is located at 1413 Cleveland Ave, Streator, IL 61364 and is currently estimated at $85,380, approximately $64 per square foot. 1413 Cleveland Ave is a home located in Livingston County with nearby schools including Woodland Elementary/Junior High School, Woodland High School, and St. Michael the Archangel Catholic School.
Ownership History
Date
Name
Owned For
Owner Type
Purchase Details
Closed on
Jul 1, 2022
Sold by
Freeman Joshua C and John Freeman Revocable Trust John Freeman Rev
Bought by
Turner James R and Turnersville Usa Revocable Trust
Current Estimated Value
Home Financials for this Owner
Home Financials are based on the most recent Mortgage that was taken out on this home.
Original Mortgage
$18,400
Outstanding Balance
$17,506
Interest Rate
5.09%
Mortgage Type
New Conventional
Estimated Equity
$67,875
Purchase Details
Closed on
Feb 14, 2022
Sold by
Freeman John
Bought by
Freeman John and John Freeman Revocable Living
Purchase Details
Closed on
Mar 21, 2011
Sold by
Wright Willard E and Wright Katherine M
Bought by
Freeman John
Home Financials for this Owner
Home Financials are based on the most recent Mortgage that was taken out on this home.
Original Mortgage
$17,000
Interest Rate
4.92%
Create a Home Valuation Report for This Property
The Home Valuation Report is an in-depth analysis detailing your home's value as well as a comparison with similar homes in the area
Home Values in the Area
Average Home Value in this Area
Purchase History
| Date | Buyer | Sale Price | Title Company |
|---|---|---|---|
| Turner James R | $23,000 | None Available | |
| Freeman John | -- | None Available | |
| Freeman John | $20,000 | -- |
Source: Public Records
Mortgage History
| Date | Status | Borrower | Loan Amount |
|---|---|---|---|
| Open | Turner James R | $18,400 | |
| Previous Owner | Freeman John | $17,000 |
Source: Public Records
Tax History Compared to Growth
Tax History
| Year | Tax Paid | Tax Assessment Tax Assessment Total Assessment is a certain percentage of the fair market value that is determined by local assessors to be the total taxable value of land and additions on the property. | Land | Improvement |
|---|---|---|---|---|
| 2024 | $724 | $9,462 | $1,883 | $7,579 |
| 2023 | $681 | $8,300 | $1,652 | $6,648 |
| 2022 | $4 | $8,425 | $1,652 | $6,773 |
| 2021 | $0 | $8,087 | $1,553 | $6,534 |
| 2020 | $0 | $7,523 | $1,445 | $6,078 |
| 2019 | $5 | $6,902 | $1,326 | $5,576 |
| 2018 | $0 | $7,789 | $1,367 | $6,422 |
| 2017 | $5 | $7,636 | $1,340 | $6,296 |
| 2016 | $5 | $7,636 | $1,340 | $6,296 |
| 2015 | $4 | $8,984 | $1,577 | $7,407 |
| 2013 | $853 | $9,962 | $1,645 | $8,317 |
Source: Public Records
Map
Nearby Homes
- 305 E 12th St
- 801 S Monroe St
- 717 S Monroe St
- 709 S Park St
- 1012 Cable St
- 804 E 12th St
- 511 S Bloomington St
- 415 W Livingston Rd
- 215 W Washington St
- 116 Lasalle St
- 921 Maple St
- 312 S Monroe St
- 701 Lundy St
- 708 Lundy St
- 211 S Bloomington St
- 202 Pleasant Ave
- 218 S Vermillion St
- 804 Lundy St
- 312 S Everett St
- 1107 Arthur St
- 1427 Cleveland Ave
- 1411 Cleveland Ave
- 1310 Cleveland Ave
- 1303 Cleveland Ave
- 119 W 12th St
- 1305 Cleveland Ave
- 110 W 12th St
- 1306 Cleveland Ave
- 1307 Cleveland Ave
- 112 W 12th St
- 114 W 12th St
- 108 W 12th St
- 116 W 12th St
- 1311 Cleveland Ave
- 123 W 12th St
- 120 W 12th St
- 1424 Cleveland Ave
- 1302 S Bloomington St
- 1313 Cleveland Ave
- 122 W 12th St