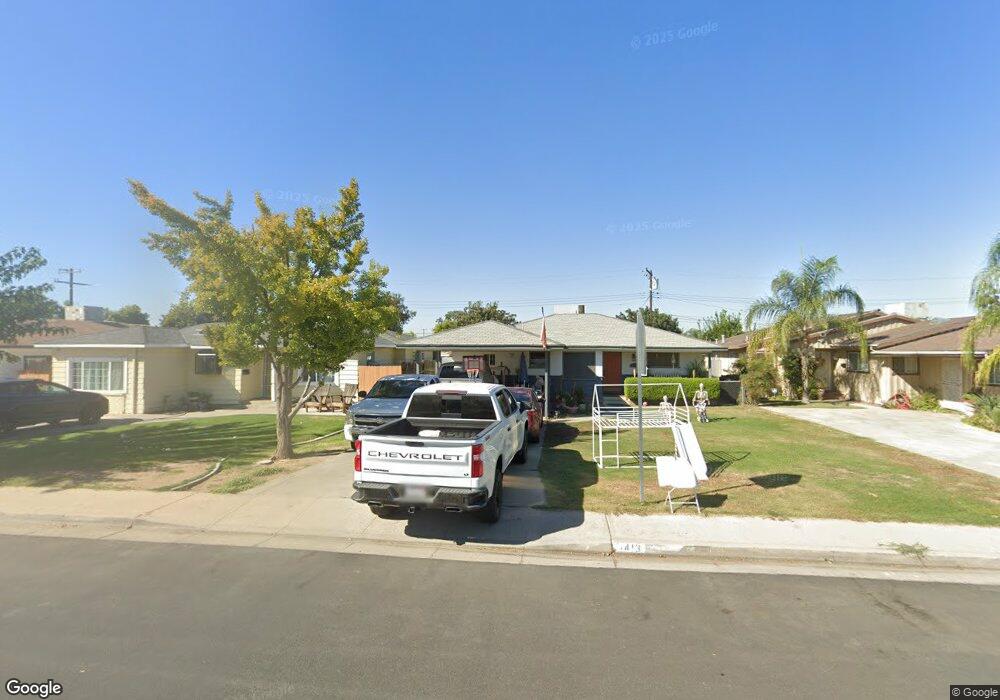
1413 Dover Place Delano, CA 93215
West Delano NeighborhoodEstimated Value: $296,696 - $338,000
4
Beds
2
Baths
1,450
Sq Ft
$219/Sq Ft
Est. Value
About This Home
This home is located at 1413 Dover Place, Delano, CA 93215 and is currently estimated at $318,174, approximately $219 per square foot. 1413 Dover Place is a home located in Kern County with nearby schools including Fremont Elementary School, Almond Tree Middle School, and Robert F. Kennedy High School.
Ownership History
Date
Name
Owned For
Owner Type
Purchase Details
Closed on
Jun 9, 2009
Sold by
Argel Celeste
Bought by
Argel Larry
Current Estimated Value
Home Financials for this Owner
Home Financials are based on the most recent Mortgage that was taken out on this home.
Original Mortgage
$132,554
Outstanding Balance
$83,704
Interest Rate
4.76%
Mortgage Type
FHA
Estimated Equity
$234,470
Purchase Details
Closed on
May 29, 2009
Sold by
Argel Larry and Deberry Gloria
Bought by
Chavez Jesus A
Home Financials for this Owner
Home Financials are based on the most recent Mortgage that was taken out on this home.
Original Mortgage
$132,554
Outstanding Balance
$83,704
Interest Rate
4.76%
Mortgage Type
FHA
Estimated Equity
$234,470
Purchase Details
Closed on
Dec 7, 2005
Sold by
Tarape Helen Argel and Argel Larry
Bought by
Argel Larry and Deberry Gloria
Purchase Details
Closed on
Jul 13, 1999
Sold by
Argel John
Bought by
Tarape Helen Argel
Purchase Details
Closed on
Feb 10, 1995
Sold by
Tarape Helen Argel
Bought by
Argel Larry and Deberry Gloria
Create a Home Valuation Report for This Property
The Home Valuation Report is an in-depth analysis detailing your home's value as well as a comparison with similar homes in the area
Home Values in the Area
Average Home Value in this Area
Purchase History
| Date | Buyer | Sale Price | Title Company |
|---|---|---|---|
| Argel Larry | -- | Chicago Title Company | |
| Argel Frederick | -- | Chicago Title Company | |
| Chavez Jesus A | $135,000 | Chicago Title Company | |
| Argel Larry | -- | None Available | |
| Tarape Helen Argel | -- | -- | |
| Argel Larry | -- | -- |
Source: Public Records
Mortgage History
| Date | Status | Borrower | Loan Amount |
|---|---|---|---|
| Open | Chavez Jesus A | $132,554 |
Source: Public Records
Tax History
| Year | Tax Paid | Tax Assessment Tax Assessment Total Assessment is a certain percentage of the fair market value that is determined by local assessors to be the total taxable value of land and additions on the property. | Land | Improvement |
|---|---|---|---|---|
| 2025 | $2,080 | $173,830 | $38,623 | $135,207 |
| 2024 | $2,022 | $170,422 | $37,866 | $132,556 |
| 2023 | $2,022 | $167,081 | $37,124 | $129,957 |
| 2022 | $1,989 | $163,806 | $36,397 | $127,409 |
| 2021 | $1,915 | $160,595 | $35,684 | $124,911 |
| 2020 | $1,916 | $158,950 | $35,319 | $123,631 |
| 2019 | $1,883 | $158,950 | $35,319 | $123,631 |
| 2018 | $1,859 | $152,780 | $33,949 | $118,831 |
| 2017 | $1,871 | $149,785 | $33,284 | $116,501 |
| 2016 | $1,840 | $146,849 | $32,632 | $114,217 |
| 2015 | $1,895 | $144,000 | $36,000 | $108,000 |
| 2014 | $1,420 | $112,000 | $28,000 | $84,000 |
Source: Public Records
Map
Nearby Homes
- 1417 Dover Place
- 1409 Dover Place
- 1421 Dover Place
- 1414 Dover St
- 1425 Dover Place
- 417 14th Ave
- 1418 Dover St
- 1410 Dover St
- 1422 Dover St
- 325 14th Ave
- 1429 Dover Place
- 1414 Dover Place
- 1426 Dover St
- 1410 Dover Place
- 1418 Dover Place
- 1406 Dover Place
- 1424 Dover Place
- 404 15th Ave
- 450 15th Ave
- 415 15th Ave
Your Personal Tour Guide
Ask me questions while you tour the home.