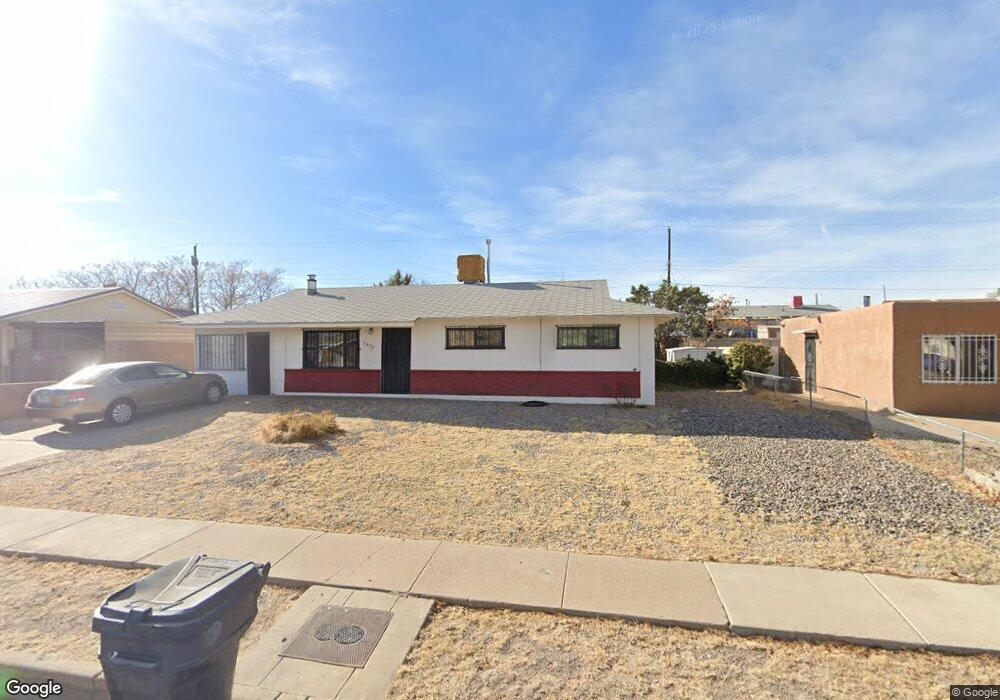
1413 Elfego Baca Dr SW Albuquerque, NM 87121
Southwest Heights NeighborhoodEstimated Value: $216,000 - $237,000
2
Beds
2
Baths
1,270
Sq Ft
$181/Sq Ft
Est. Value
About This Home
This home is located at 1413 Elfego Baca Dr SW, Albuquerque, NM 87121 and is currently estimated at $229,756, approximately $180 per square foot. 1413 Elfego Baca Dr SW is a home located in Bernalillo County with nearby schools including Carlos Rey Elementary School, Tony Hillerman Middle School, and Atrisco Heritage Academy High School.
Create a Home Valuation Report for This Property
The Home Valuation Report is an in-depth analysis detailing your home's value as well as a comparison with similar homes in the area
Home Values in the Area
Average Home Value in this Area
Tax History Compared to Growth
Tax History
| Year | Tax Paid | Tax Assessment Tax Assessment Total Assessment is a certain percentage of the fair market value that is determined by local assessors to be the total taxable value of land and additions on the property. | Land | Improvement |
|---|---|---|---|---|
| 2024 | $1,121 | $32,570 | $9,348 | $23,222 |
| 2023 | $1,095 | $31,621 | $9,076 | $22,545 |
| 2022 | $1,051 | $30,701 | $8,812 | $21,889 |
| 2021 | $1,008 | $29,807 | $8,555 | $21,252 |
| 2020 | $984 | $28,940 | $8,307 | $20,633 |
| 2019 | $948 | $28,097 | $8,065 | $20,032 |
| 2018 | $906 | $28,097 | $8,065 | $20,032 |
| 2017 | $871 | $27,278 | $7,830 | $19,448 |
| 2016 | $839 | $25,713 | $7,381 | $18,332 |
| 2015 | $24,964 | $24,964 | $7,166 | $17,798 |
| 2014 | $805 | $24,964 | $7,166 | $17,798 |
| 2013 | -- | $25,198 | $7,166 | $18,032 |
Source: Public Records
Map
Nearby Homes
- 1401 Elfego Baca Dr SW
- 1520 Elfego Baca Dr SW Unit 2
- 10709 Anaya St SW
- 1309 Canyon Trail SW
- 11105 Pecos Place SW
- 10622 Benavides Rd SW
- 1111 Carla St SW
- 10915 Denton Rd SW
- 10312 Cornelia Ct SW
- 2204 San Leon St SW
- 10423 Jenaro Ct SW
- 11004 Teal Rd SW
- 10427 Sandy Flats Ave SW
- 11024 Bowie Rd SW
- 10216 Teal Rd SW
- 919 Crane Dr SW
- 2105 Hermosa Creek Dr SW
- 10760 Four Mile Rd SW
- 10820 Corona Ranch Rd SW
- 10409 Red Robin Rd SW
- 1409 Elfego Baca Dr SW
- 1419 Elfego Baca Dr SW
- 1414 Del Monte Trail SW
- 1423 Elfego Baca Dr SW
- 1414 Elfego Baca Dr SW
- 1420 Del Monte Trail SW
- 1410 Del Monte Trail SW
- 1420 Elfego Baca Dr SW
- 1410 Elfego Baca Dr SW
- 1405 Elfego Baca Dr SW
- 1424 Del Monte Trail SW
- 1406 Del Monte Trail SW
- 1501 Elfego Baca Dr SW
- 1424 Elfego Baca Dr SW
- 1406 Elfego Baca Dr SW
- 1502 Del Monte Trail SW Unit 2
- 1402 Del Monte Trail SW
- 1402 Elfego Baca Dr SW
- 1413 Del Monte Trail SW
- 1419 Canyon Trail SW