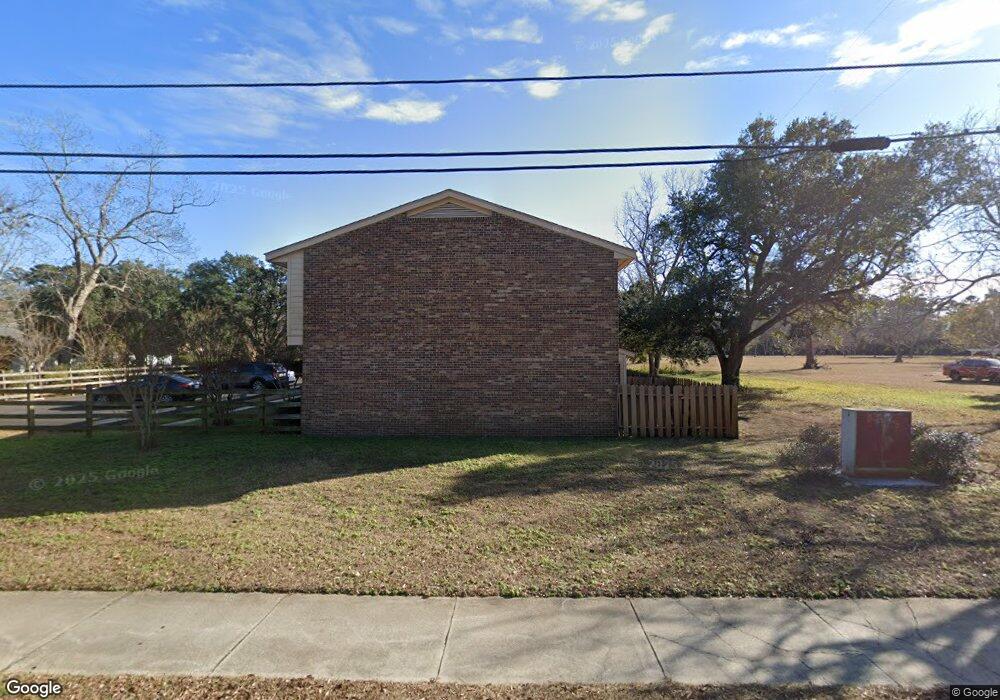
1413 Highway 15 Myrtle Beach, SC 29577
Downtown Myrtle Beach NeighborhoodEstimated Value: $171,000 - $191,000
--
Bed
2
Baths
1,114
Sq Ft
$162/Sq Ft
Est. Value
About This Home
This home is located at 1413 Highway 15, Myrtle Beach, SC 29577 and is currently estimated at $180,133, approximately $161 per square foot. 1413 Highway 15 is a home located in Horry County with nearby schools including Myrtle Beach Child Development Center, Myrtle Beach Primary School, and Myrtle Beach Elementary School.
Ownership History
Date
Name
Owned For
Owner Type
Purchase Details
Closed on
Jan 2, 2025
Sold by
Roberts Rebecca Mae
Bought by
Piccarillo Matthew L
Current Estimated Value
Home Financials for this Owner
Home Financials are based on the most recent Mortgage that was taken out on this home.
Original Mortgage
$151,607
Outstanding Balance
$150,370
Interest Rate
6.6%
Mortgage Type
FHA
Estimated Equity
$29,763
Purchase Details
Closed on
Jan 25, 2021
Sold by
Clemmons Alan D
Bought by
Roberts Rebecca Mae
Home Financials for this Owner
Home Financials are based on the most recent Mortgage that was taken out on this home.
Original Mortgage
$128,250
Interest Rate
2.6%
Mortgage Type
New Conventional
Purchase Details
Closed on
Jan 12, 2007
Sold by
Plantation Crest Homeowners Assn Inc
Bought by
Clemmons Alan D and Clemmons Laura F
Purchase Details
Closed on
Feb 14, 2006
Sold by
Carmichael Jo M and Zeigler Jo M
Bought by
Plantation Crest Homeowners Assn Inc
Create a Home Valuation Report for This Property
The Home Valuation Report is an in-depth analysis detailing your home's value as well as a comparison with similar homes in the area
Home Values in the Area
Average Home Value in this Area
Purchase History
| Date | Buyer | Sale Price | Title Company |
|---|---|---|---|
| Piccarillo Matthew L | $176,000 | -- | |
| Roberts Rebecca Mae | $135,000 | -- | |
| Clemmons Alan D | $140,000 | None Available | |
| Plantation Crest Homeowners Assn Inc | $70,000 | None Available |
Source: Public Records
Mortgage History
| Date | Status | Borrower | Loan Amount |
|---|---|---|---|
| Open | Piccarillo Matthew L | $151,607 | |
| Previous Owner | Roberts Rebecca Mae | $128,250 |
Source: Public Records
Tax History Compared to Growth
Tax History
| Year | Tax Paid | Tax Assessment Tax Assessment Total Assessment is a certain percentage of the fair market value that is determined by local assessors to be the total taxable value of land and additions on the property. | Land | Improvement |
|---|---|---|---|---|
| 2024 | $611 | $10,395 | $3,600 | $6,795 |
| 2023 | $611 | $2,571 | $400 | $2,171 |
| 2021 | $549 | $4,368 | $600 | $3,768 |
| 2020 | $995 | $4,368 | $600 | $3,768 |
| 2019 | $995 | $4,368 | $600 | $3,768 |
| 2018 | $0 | $3,354 | $600 | $2,754 |
| 2017 | $881 | $3,354 | $600 | $2,754 |
| 2016 | -- | $3,354 | $600 | $2,754 |
| 2015 | $871 | $3,354 | $600 | $2,754 |
| 2014 | $847 | $3,354 | $600 | $2,754 |
Source: Public Records
Map
Nearby Homes
- 1405 Highway 15
- 1409 Highway 15 Unit 4
- 1504 Highway 15 Unit Lot 32
- 1303 Highway 15
- 1208 Pinegrove Dr Unit D
- 1065 Pinwheel Loop
- 1046 Portico Loop
- 1048 Portico Loop
- 1210 Pinegrove Dr Unit G
- 1221 Alberta Dr
- 1083 Pinwheel Loop
- 1207 Pinegrove Dr Unit C
- 1207 Pinegrove Dr Unit B
- 1207 Pinegrove Dr Unit D
- 1207 Pinegrove Dr
- 990 Palisade Cir
- 1105 Highway 15
- 904 Periwinkle Place
- 964 Palisade Cir
- 916 Periwinkle Place
- 1413 Highway 15 Unit 1
- 1413 Highway 15 Unit 1409 hwy 15 unit 3
- 1413 Highway 15 Unit 1409 hwy 15 unit 5
- 1413 Highway 15 Unit 1409 hwy 15 unit 1
- 1504 Highway 15
- 1504 Highway 15 Unit Lot 50
- 1501 Highway 15 Unit 642
- 1501 Highway 15
- 1411 Highway 15 Unit 1
- 1405 Highway 15 Unit 1411 Highway 15
- 1507 Highway 15
- 1406 Leroy Ln
- 1406 Highway 15 Ln
- 1403 Highway 15
- 1403 Highway 15
- 1202 Pinegrove Dr Unit 7B
- 1409 Highway 15 Unit 2
- 1409 Highway 15 Unit 3
- 1409 Highway 15 Unit 1
- 1200F Pinegrove Dr Unit 6B