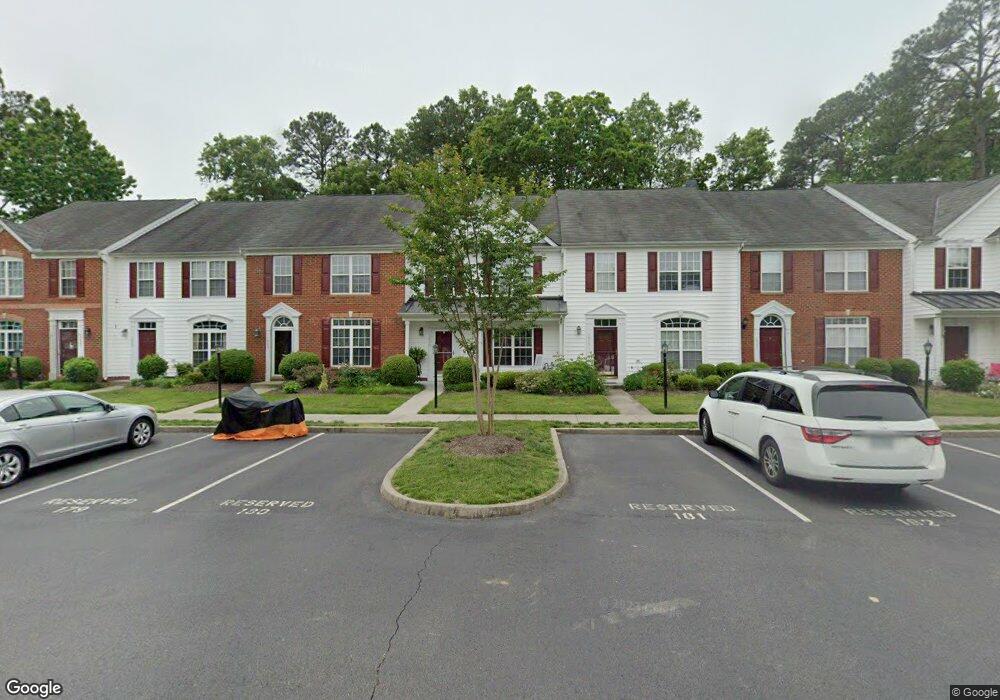
1413 Olde Sage Ct Glen Allen, VA 23059
Twin Hickory NeighborhoodEstimated Value: $438,000 - $466,000
3
Beds
3
Baths
1,850
Sq Ft
$244/Sq Ft
Est. Value
About This Home
This home is located at 1413 Olde Sage Ct, Glen Allen, VA 23059 and is currently estimated at $451,465, approximately $244 per square foot. 1413 Olde Sage Ct is a home located in Henrico County with nearby schools including Twin Hickory Elementary School, Holman Middle School, and Deep Run High School.
Ownership History
Date
Name
Owned For
Owner Type
Purchase Details
Closed on
Nov 28, 2018
Sold by
Jin Chengwei and Sun Xiaoxia
Bought by
Cech Jiri and Zaremska Sylvia
Current Estimated Value
Home Financials for this Owner
Home Financials are based on the most recent Mortgage that was taken out on this home.
Original Mortgage
$200,000
Outstanding Balance
$176,204
Interest Rate
4.8%
Mortgage Type
New Conventional
Estimated Equity
$275,261
Purchase Details
Closed on
May 31, 2013
Sold by
Chan Kwan L and Lam Yuk Y
Bought by
Jin Chengwei and Sun Xiaoxia
Purchase Details
Closed on
Feb 18, 2010
Sold by
Citibank National Association
Bought by
Chan Kwan L and Lam Yuk Y
Purchase Details
Closed on
Nov 16, 2009
Sold by
Commonwealth Trustees Llc
Bought by
Citibank
Purchase Details
Closed on
Mar 1, 2006
Sold by
Nvr Inc
Bought by
Eagle Christopher A
Home Financials for this Owner
Home Financials are based on the most recent Mortgage that was taken out on this home.
Original Mortgage
$217,100
Interest Rate
6.32%
Mortgage Type
New Conventional
Create a Home Valuation Report for This Property
The Home Valuation Report is an in-depth analysis detailing your home's value as well as a comparison with similar homes in the area
Home Values in the Area
Average Home Value in this Area
Purchase History
| Date | Buyer | Sale Price | Title Company |
|---|---|---|---|
| Cech Jiri | $275,000 | Day Title Services Lc | |
| Jin Chengwei | $225,000 | -- | |
| Chan Kwan L | $200,000 | -- | |
| Citibank | $227,000 | -- | |
| Eagle Christopher A | $271,398 | -- |
Source: Public Records
Mortgage History
| Date | Status | Borrower | Loan Amount |
|---|---|---|---|
| Open | Cech Jiri | $200,000 | |
| Previous Owner | Eagle Christopher A | $217,100 |
Source: Public Records
Tax History Compared to Growth
Tax History
| Year | Tax Paid | Tax Assessment Tax Assessment Total Assessment is a certain percentage of the fair market value that is determined by local assessors to be the total taxable value of land and additions on the property. | Land | Improvement |
|---|---|---|---|---|
| 2025 | $3,485 | $361,200 | $74,000 | $287,200 |
| 2024 | $3,485 | $356,300 | $74,000 | $282,300 |
| 2023 | $3,029 | $356,300 | $74,000 | $282,300 |
| 2022 | $2,672 | $314,300 | $74,000 | $240,300 |
| 2021 | $2,560 | $273,900 | $62,000 | $211,900 |
| 2020 | $2,383 | $273,900 | $62,000 | $211,900 |
| 2019 | $2,275 | $261,500 | $62,000 | $199,500 |
| 2018 | $2,184 | $251,000 | $62,000 | $189,000 |
| 2017 | $2,121 | $243,800 | $62,000 | $181,800 |
| 2016 | $2,051 | $235,800 | $54,000 | $181,800 |
| 2015 | $1,911 | $235,800 | $54,000 | $181,800 |
| 2014 | $1,911 | $219,600 | $54,000 | $165,600 |
Source: Public Records
Map
Nearby Homes
- 4905 Old Millrace Place
- 0 Manakin Rd Unit VAGO2000320
- 10605 Gate House Ct
- 5132 Park Commons Loop
- 11944 Belmont Park Ct
- 5004 Parkcrest Ct
- 5012 Park Commons Loop
- 11012 Ellis Meadows Ln
- 5525 Barnsley Terrace
- 11408 Maple Hill Place
- 12109 Oxford Landing Dr Unit 104
- 12109 Oxford Landing Dr Unit 201
- 12109 Oxford Landing Dr Unit 102
- 11532 Saddleridge Rd
- 5046 Willows Green Rd
- 11700 Autumnwood Ct
- 11141 Opaca Ln
- 12008 Stable Ridge Terrace
- 5614 Benoni Ct
- 918 Jamerson Ln Unit 918
- 1413 Olde Sage Ct Unit n/a
- 1417 Olde Sage Ct
- 1417 Olde Sage Ct
- 1417 Olde Sage Ct Unit INTERIOR
- 1409 Olde Sage Ct
- 1421 Olde Sage Ct
- 1405 Olde Sage Ct
- 1401 Olde Sage Ct
- 1401 Olde Sage Ct Unit END
- 1425 Olde Sage Ct
- 1425 Olde Sage Ct Unit END
- 1400 Olde Sage Ct
- 1501 Olde Sage Ct
- 1501 Olde Sage Ct Unit 1501
- 1404 Olde Sage Ct
- 1404 Olde Sage Ct Unit 1404
- 11444 Pinedale Dr
- 1505 Olde Sage Ct
- 11452 Pinedale Dr
- LOT 4 Olde Sage Ct Unit INTERIOR