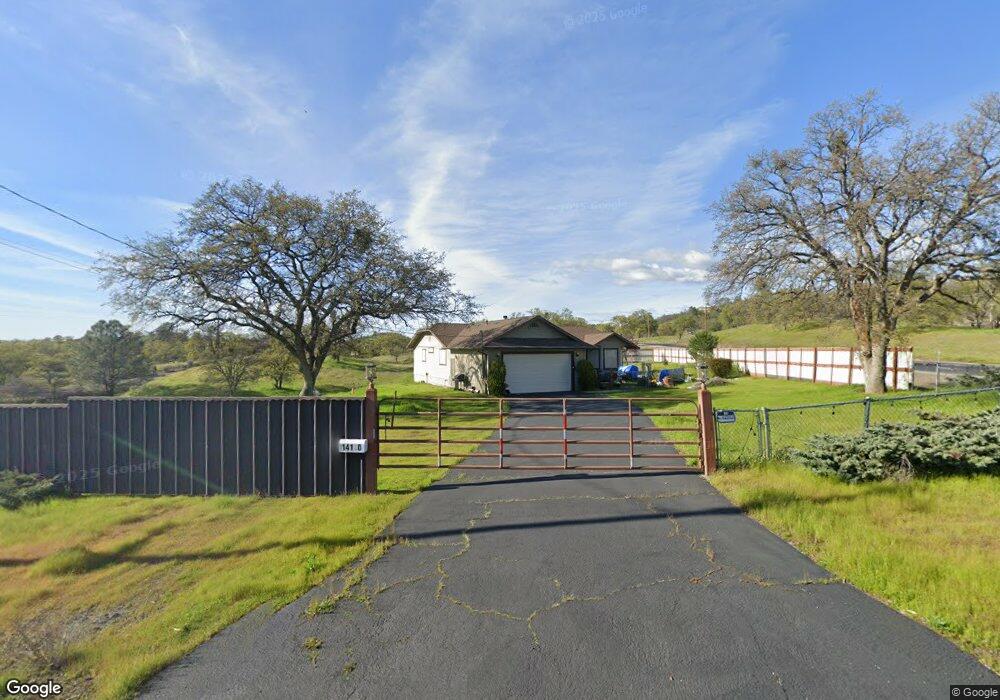
14130 Isabel Way La Grange, CA 95329
Estimated Value: $417,000 - $494,000
3
Beds
2
Baths
2,059
Sq Ft
$217/Sq Ft
Est. Value
About This Home
This home is located at 14130 Isabel Way, La Grange, CA 95329 and is currently estimated at $445,956, approximately $216 per square foot. 14130 Isabel Way is a home located in Tuolumne County.
Ownership History
Date
Name
Owned For
Owner Type
Purchase Details
Closed on
Oct 27, 2022
Sold by
Kelly Marilyn C
Bought by
Marilyn Carol Kelly Revocable Trust
Current Estimated Value
Purchase Details
Closed on
Mar 23, 2017
Sold by
Kelley Marilyn C
Bought by
Weber Christopher J
Purchase Details
Closed on
May 24, 2010
Sold by
Carter Little Hance and Carter Lavona M
Bought by
Weber Christopher J and Kelly Marilyn C
Home Financials for this Owner
Home Financials are based on the most recent Mortgage that was taken out on this home.
Original Mortgage
$152,940
Interest Rate
5.03%
Mortgage Type
FHA
Purchase Details
Closed on
Aug 30, 2006
Sold by
Redling Loyce Geraldine
Bought by
Carter Little Hance and Carter Lavona M
Home Financials for this Owner
Home Financials are based on the most recent Mortgage that was taken out on this home.
Original Mortgage
$125,000
Interest Rate
6.67%
Mortgage Type
Unknown
Create a Home Valuation Report for This Property
The Home Valuation Report is an in-depth analysis detailing your home's value as well as a comparison with similar homes in the area
Home Values in the Area
Average Home Value in this Area
Purchase History
| Date | Buyer | Sale Price | Title Company |
|---|---|---|---|
| Marilyn Carol Kelly Revocable Trust | -- | -- | |
| Weber Christopher J | -- | First American Title Company | |
| Weber Christopher J | $155,000 | First American Title Company | |
| Carter Little Hance | $425,000 | Alliance Title Company |
Source: Public Records
Mortgage History
| Date | Status | Borrower | Loan Amount |
|---|---|---|---|
| Previous Owner | Weber Christopher J | $152,940 | |
| Previous Owner | Carter Little Hance | $125,000 |
Source: Public Records
Tax History Compared to Growth
Tax History
| Year | Tax Paid | Tax Assessment Tax Assessment Total Assessment is a certain percentage of the fair market value that is determined by local assessors to be the total taxable value of land and additions on the property. | Land | Improvement |
|---|---|---|---|---|
| 2025 | $4,247 | $395,086 | $64,945 | $330,141 |
| 2024 | $4,247 | $387,340 | $63,672 | $323,668 |
| 2023 | $4,154 | $379,746 | $62,424 | $317,322 |
| 2022 | $4,073 | $372,300 | $61,200 | $311,100 |
| 2021 | $2,451 | $229,884 | $44,404 | $185,480 |
| 2020 | $2,410 | $227,528 | $43,949 | $183,579 |
| 2019 | $2,334 | $223,068 | $43,088 | $179,980 |
| 2018 | $2,278 | $218,695 | $42,244 | $176,451 |
| 2017 | $1,792 | $172,388 | $44,487 | $127,901 |
| 2016 | $1,744 | $169,009 | $43,615 | $125,394 |
| 2015 | $1,721 | $166,471 | $42,960 | $123,511 |
| 2014 | $1,679 | $163,211 | $42,119 | $121,092 |
Source: Public Records
Map
Nearby Homes
- 837 Castillo Way
- 3601 Ladera Way
- 0 Castillo Way Unit 225043107
- 0 Castillo Way Unit 225125624
- 13695 Barro Ct
- 4577 Madreselva St
- 13651 Barro Ct
- 0 Ladera Way Unit 41082157
- 10324 Gusanillo Way
- 0 Hoyito Cir
- 0 Arbolada Dr Unit 224065324
- 0 Arbolada Dr Unit 41114682
- 3357 Maravilla Dr
- 10090 Arbolada Dr
- 00000 Arbolada Dr
- 2730 Pepito Dr
- 0 Pepito Dr Unit 225112375
- 0 Pepito Dr Unit 222132440
- 3196 Granite Springs Rd
- 10502 Enramada Dr
- 3910 Castillo Way
- 14116 Isabel Way
- 3860 Ladera Way
- 3821 State Highway 132
- 3823 Ladera Way
- 894 Isabel Way
- 896 Isabel Way
- 3893 3t893 Isabel Way
- 0 Isabel Way Unit 224129510
- 0 Isabel Way Unit 223111520
- 0 Isabel Way Unit 20079291
- 3T893 Isabel Way
- 0 Isabel Way
- 14109 Isabel Way
- 14109 Isabel Way
- 3929 Abeto St
- 3891 Castillo Way
- 3905 Abeto St
- 3975 Castillo Way
- 3791 Ladera Way