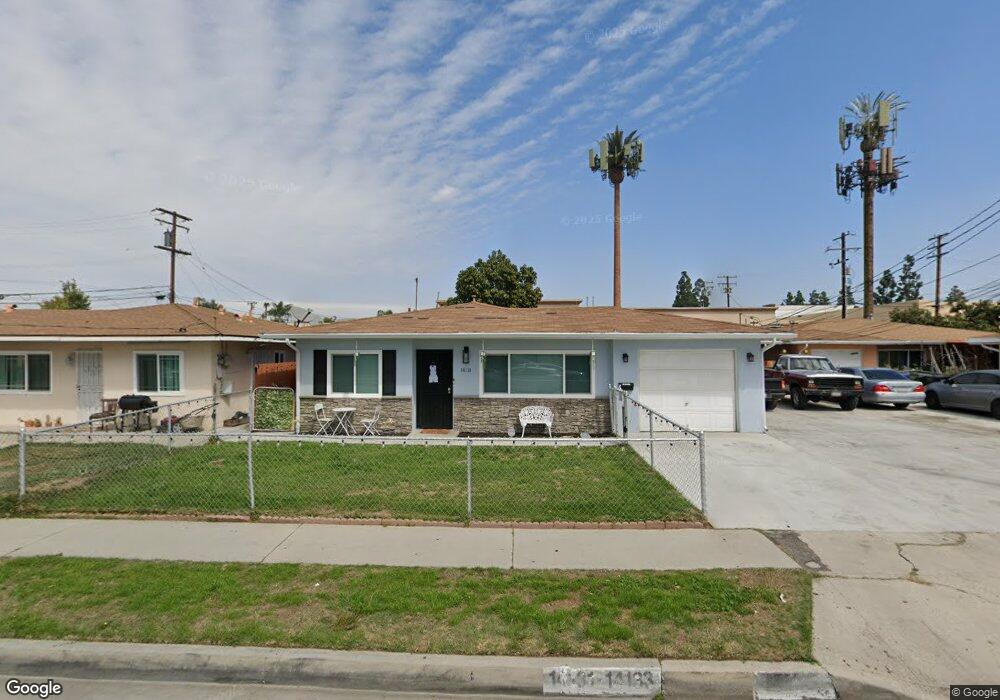
14131 Broadway Whittier, CA 90604
South Whittier NeighborhoodEstimated Value: $984,000 - $1,483,000
10
Beds
4
Baths
4,056
Sq Ft
$304/Sq Ft
Est. Value
About This Home
This home is located at 14131 Broadway, Whittier, CA 90604 and is currently estimated at $1,231,000, approximately $303 per square foot. 14131 Broadway is a home located in Los Angeles County with nearby schools including Ceres Elementary School, Hillview Middle School, and California High School.
Ownership History
Date
Name
Owned For
Owner Type
Purchase Details
Closed on
Feb 25, 2003
Sold by
Grw Partnership
Bought by
Regatta Investors Llc and Stratford Regatta Rentals Llc
Current Estimated Value
Purchase Details
Closed on
Jun 6, 2002
Sold by
Monge Ruben
Bought by
Whittier 26 Llc
Home Financials for this Owner
Home Financials are based on the most recent Mortgage that was taken out on this home.
Original Mortgage
$7,250,000
Interest Rate
6.74%
Purchase Details
Closed on
Sep 25, 1997
Sold by
Delarosa Esperanza P
Bought by
Delarosa Alfonso and Alfonso Delarosa Trust
Purchase Details
Closed on
Jan 28, 1996
Sold by
Delarosa Alfonso
Bought by
Delarosa Esperanza Patricia
Purchase Details
Closed on
Jan 27, 1996
Sold by
Delarosa Alfonso and The Delarosa Trust
Bought by
Delarosa Alfonso
Purchase Details
Closed on
Nov 28, 1994
Sold by
Delarosa Alfonso
Bought by
Delarosa Esperanza Patricia
Create a Home Valuation Report for This Property
The Home Valuation Report is an in-depth analysis detailing your home's value as well as a comparison with similar homes in the area
Home Values in the Area
Average Home Value in this Area
Purchase History
| Date | Buyer | Sale Price | Title Company |
|---|---|---|---|
| Regatta Investors Llc | $11,350,000 | First American Title Ins Co | |
| Grw Partnership | $10,100,000 | First American Title Ins Co | |
| Whittier 26 Llc | $6,175,000 | First American Title Ins Co | |
| Delarosa Alfonso | -- | -- | |
| Delarosa Esperanza Patricia | -- | -- | |
| Delarosa Alfonso | -- | -- | |
| Delarosa Esperanza Patricia | -- | -- |
Source: Public Records
Mortgage History
| Date | Status | Borrower | Loan Amount |
|---|---|---|---|
| Previous Owner | Whittier 26 Llc | $7,250,000 |
Source: Public Records
Tax History Compared to Growth
Tax History
| Year | Tax Paid | Tax Assessment Tax Assessment Total Assessment is a certain percentage of the fair market value that is determined by local assessors to be the total taxable value of land and additions on the property. | Land | Improvement |
|---|---|---|---|---|
| 2025 | $6,359 | $415,133 | $132,835 | $282,298 |
| 2024 | $6,359 | $406,994 | $130,231 | $276,763 |
| 2023 | $5,924 | $399,015 | $127,678 | $271,337 |
| 2022 | $5,807 | $391,192 | $125,175 | $266,017 |
| 2021 | $5,684 | $383,522 | $122,721 | $260,801 |
| 2020 | $5,628 | $379,590 | $121,463 | $258,127 |
| 2019 | $5,579 | $372,148 | $119,082 | $253,066 |
| 2018 | $5,260 | $364,852 | $116,748 | $248,104 |
| 2016 | $4,963 | $350,686 | $112,215 | $238,471 |
| 2015 | $4,929 | $345,419 | $110,530 | $234,889 |
| 2014 | $4,886 | $338,653 | $108,365 | $230,288 |
Source: Public Records
Map
Nearby Homes
- 14146 Light St
- 14037 Mystic St
- 10035 Ben Hur Ave
- 10241 Ruoff Ave
- 14518 Rimgate Dr
- 14042 Hawes St
- 14033 Oval Dr
- 14520 Mulberry Dr
- 14076 Cornishcrest Rd
- 13856 Mulberry Dr
- 10745 Victoria Ave Unit 6
- 10745 Victoria Ave
- 13649 Reis St
- 9551 Barkerville Ave
- 10415 Valley View Ave
- 13752 Bentongrove Dr
- 10123 Lanett Ave
- 11102 Eagle Ln
- 11118 Bunker Ln
- 10855 Colima Rd
- 14127 Broadway
- 14147 Broadway
- 14125 Broadway
- 14151 Broadway
- 14115 Broadway
- 14117 Broadway
- 14136 Broadway
- 14134 Broadway
- 14155 Broadway
- 14126 Broadway
- 14142 Broadway
- 14120 Broadway
- 14161 Broadway
- 10088 Mills Ave
- 10205 Victoria Ave
- 14114 Broadway
- 10076 Mills Ave
- 14165 Broadway
- 10064 Mills Ave Unit E
- 10064 Mills Ave