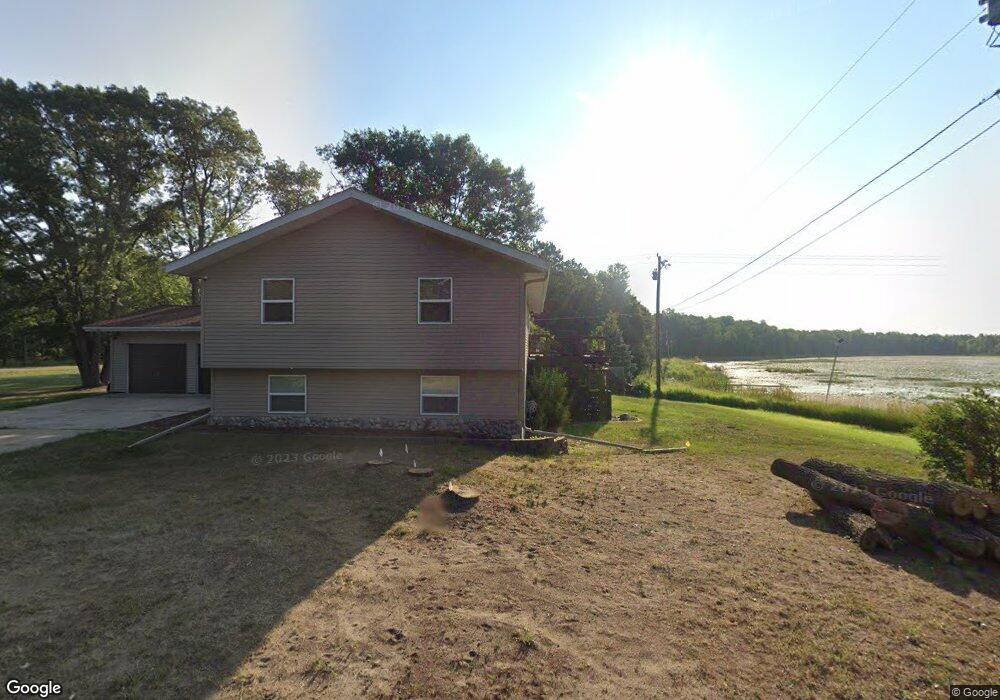
14138 Kimberlee Ct Baxter, MN 56425
Estimated Value: $340,000 - $417,000
5
Beds
3
Baths
1,416
Sq Ft
$258/Sq Ft
Est. Value
About This Home
This home is located at 14138 Kimberlee Ct, Baxter, MN 56425 and is currently estimated at $364,765, approximately $257 per square foot. 14138 Kimberlee Ct is a home located in Crow Wing County with nearby schools including Baxter Elementary School, Forestview Middle School, and Brainerd Senior High School.
Ownership History
Date
Name
Owned For
Owner Type
Purchase Details
Closed on
Apr 20, 2017
Sold by
Clark Robin F and Clark Cheryl L
Bought by
Brodal Vincent R and Rademacher Kelsey J
Current Estimated Value
Purchase Details
Closed on
Mar 1, 2006
Sold by
Gady Richard and Gady Nancy
Bought by
Clark Robin and Clark Cheryl
Purchase Details
Closed on
Jul 1, 2005
Sold by
Taylor Derrick and Taylor Renee
Bought by
Clark Cheryl and Clark Robin
Purchase Details
Closed on
Oct 1, 2004
Sold by
Taylor Derrick and Taylor Renee
Bought by
Gady Richard
Purchase Details
Closed on
Sep 1, 2004
Sold by
Winkler Tina M
Bought by
Fountain Properties, Llc
Purchase Details
Closed on
Apr 1, 2001
Sold by
Clinton J Nelson
Bought by
Winkler Tina M
Purchase Details
Closed on
Dec 1, 1994
Sold by
Rask Ii Peter B
Bought by
Nelson Clinton
Create a Home Valuation Report for This Property
The Home Valuation Report is an in-depth analysis detailing your home's value as well as a comparison with similar homes in the area
Home Values in the Area
Average Home Value in this Area
Purchase History
| Date | Buyer | Sale Price | Title Company |
|---|---|---|---|
| Brodal Vincent R | $189,000 | -- | |
| Clark Robin | $190,000 | -- | |
| Clark Cheryl | $235,000 | -- | |
| Gady Richard | $144,000 | -- | |
| Fountain Properties, Llc | $176,000 | -- | |
| Winkler Tina M | $147,900 | -- | |
| Nelson Clinton | $71,000 | -- |
Source: Public Records
Tax History Compared to Growth
Tax History
| Year | Tax Paid | Tax Assessment Tax Assessment Total Assessment is a certain percentage of the fair market value that is determined by local assessors to be the total taxable value of land and additions on the property. | Land | Improvement |
|---|---|---|---|---|
| 2025 | $3,148 | $324,600 | $52,800 | $271,800 |
| 2024 | $3,148 | $325,000 | $51,500 | $273,500 |
| 2023 | $2,900 | $307,700 | $58,000 | $249,700 |
| 2022 | $2,646 | $282,500 | $43,400 | $239,100 |
| 2021 | $2,628 | $220,300 | $41,500 | $178,800 |
| 2020 | $2,524 | $213,900 | $44,800 | $169,100 |
| 2019 | $2,396 | $206,000 | $42,600 | $163,400 |
| 2018 | $2,230 | $200,700 | $42,600 | $158,100 |
| 2017 | $4,684 | $179,016 | $37,445 | $141,571 |
| 2016 | $4,692 | $158,200 | $27,300 | $130,900 |
| 2015 | $4,572 | $146,200 | $22,500 | $123,700 |
| 2014 | $2,722 | $121,500 | $13,800 | $107,700 |
Source: Public Records
Map
Nearby Homes
- L1 B1 Kimberlee Dr N
- L2 B2 Kimberlee Dr N
- L1 B2 Kimberlee Dr N
- L3 B2 Kimberlee Dr N
- TBD Lynndale Dr N
- 6116 Edmonton Rd
- 14195 Cherrywood Dr
- 14450 Blackberry Ct
- 14502 Lynndale Dr N
- Outlot A and D Rockrose Dr
- 13910 Cherrywood Dr
- 14691 Lynndale Dr
- 7205 Clearwater Rd N
- L1&2 B3 Clearwater Rd N
- L1&2 B1 Clearwater Rd N
- TBD Clearwater Rd N
- 6552 Austin Rd
- 13872 Madeline Dr
- 13709 Glenwood Dr
- 14451 Cottage Grove Dr
- 14194 Kimberlee Ct
- 14131 Kimberlee Ct
- 14129 Kimberlee Ct
- 14143 Kimberlee Ct
- 14161 Kimberlee Ct
- 14285 Kimberlee Dr
- 14283 Kimberlee Dr N
- 13065 Kenwood Dr
- 14283 Kimberlee Dr
- 14470 Kimberlee Dr N
- 14340 Kimberlee Dr
- 14268 Kimberlee Dr
- 14311 Kimberlee Dr
- 14331 Kimberlee Dr
- 14260 Kimberlee Dr
- 13971 Kenwood Dr
- 6006 Donald St
- 14269 Kimberlee Dr
- 6034 Donald St
- 14236 Kimberlee Dr