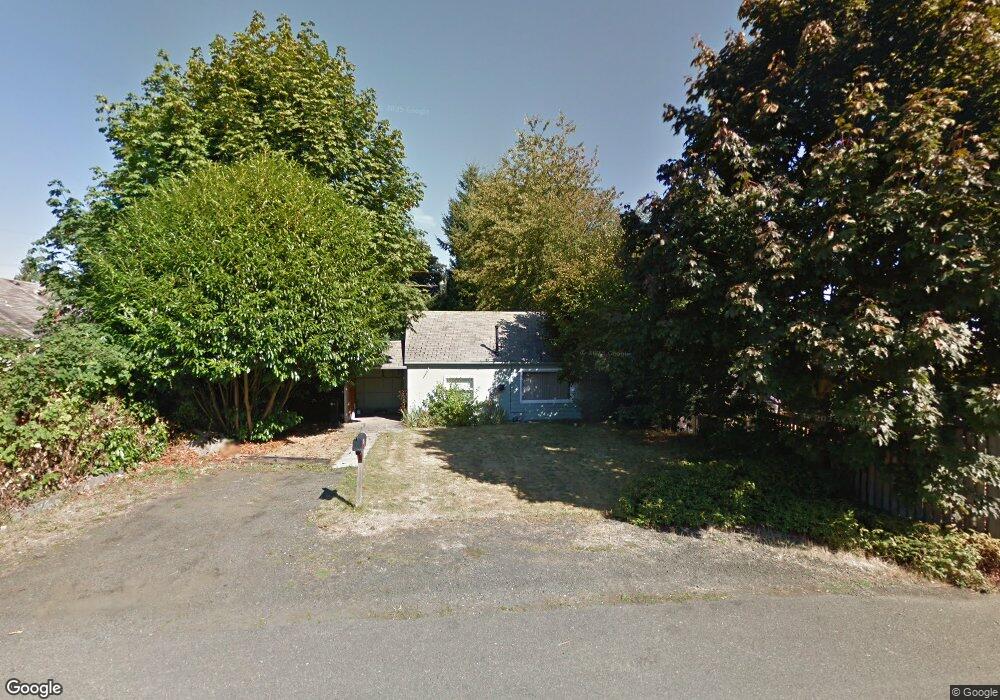
1414 8th Ave SW Olympia, WA 98502
South Westside NeighborhoodEstimated Value: $271,231 - $305,000
--
Bed
1
Bath
528
Sq Ft
$539/Sq Ft
Est. Value
About This Home
This home is located at 1414 8th Ave SW, Olympia, WA 98502 and is currently estimated at $284,558, approximately $538 per square foot. 1414 8th Ave SW is a home located in Thurston County with nearby schools including Garfield Elementary School, Jefferson Middle School, and Capital High School.
Ownership History
Date
Name
Owned For
Owner Type
Purchase Details
Closed on
Feb 16, 2017
Sold by
Poyner Jeffrey M
Bought by
Poyner Andrew M
Current Estimated Value
Home Financials for this Owner
Home Financials are based on the most recent Mortgage that was taken out on this home.
Original Mortgage
$110,580
Outstanding Balance
$91,272
Interest Rate
4.09%
Mortgage Type
New Conventional
Estimated Equity
$193,286
Purchase Details
Closed on
Nov 22, 2013
Sold by
Poyner Suzanne M
Bought by
Poyner Jeffrey M
Purchase Details
Closed on
Oct 29, 2001
Sold by
Barnes Max G
Bought by
Poyner Jeff and Poyner Suzanne
Home Financials for this Owner
Home Financials are based on the most recent Mortgage that was taken out on this home.
Original Mortgage
$76,000
Interest Rate
6.84%
Mortgage Type
Seller Take Back
Create a Home Valuation Report for This Property
The Home Valuation Report is an in-depth analysis detailing your home's value as well as a comparison with similar homes in the area
Home Values in the Area
Average Home Value in this Area
Purchase History
| Date | Buyer | Sale Price | Title Company |
|---|---|---|---|
| Poyner Andrew M | $113,719 | Thurston County Title Co | |
| Poyner Jeffrey M | -- | None Available | |
| Poyner Jeff | $76,000 | Chicago Title Insurance Comp |
Source: Public Records
Mortgage History
| Date | Status | Borrower | Loan Amount |
|---|---|---|---|
| Open | Poyner Andrew M | $110,580 | |
| Previous Owner | Poyner Jeff | $76,000 |
Source: Public Records
Tax History Compared to Growth
Tax History
| Year | Tax Paid | Tax Assessment Tax Assessment Total Assessment is a certain percentage of the fair market value that is determined by local assessors to be the total taxable value of land and additions on the property. | Land | Improvement |
|---|---|---|---|---|
| 2024 | $2,058 | $223,500 | $162,100 | $61,400 |
| 2023 | $2,058 | $196,200 | $129,800 | $66,400 |
| 2022 | $1,889 | $179,500 | $103,900 | $75,600 |
| 2021 | $1,618 | $157,600 | $93,800 | $63,800 |
| 2020 | $1,583 | $124,800 | $75,500 | $49,300 |
| 2019 | $1,382 | $119,100 | $67,200 | $51,900 |
| 2018 | $1,362 | $100,900 | $55,900 | $45,000 |
| 2017 | $1,300 | $103,550 | $64,150 | $39,400 |
| 2016 | $1,158 | $95,650 | $58,550 | $37,100 |
| 2014 | -- | $92,100 | $57,400 | $34,700 |
Source: Public Records
Map
Nearby Homes
- 821 Thomas St SW
- 101 Rogers St NW
- 113 Decatur St NW
- 133 Rogers St NW
- 805 5th Ave SW
- 1108 Harrison Ave NW
- 236 Milroy St NW
- 214 Sherman St NW
- 303 Decatur St NW
- 933 Fern St SW Unit 933
- 328 Percival St NW
- 2300 9th Ave SW Unit A5
- 1516 Decatur St SW Unit 210
- 2004 15th Ave SW
- 1720 Madison Ave NW
- 1801 Evergreen Park Ct SW Unit 10
- 1709 Fern St SW
- 1910 Evergreen Park Dr SW Unit 905
- 1407 Evergreen Park Dr SW Unit 301
- 1724 Dickinson Ave NW
- 1408 8th Ave SW
- 720 Thomas St SW
- 719 721 Plymouth St SW
- 719 Plymouth St SW Unit 721
- 1413 7th Ave SW
- 1409 7th Ave SW
- 1421 8th Ave SW
- 1423 7th Ave SW
- 705 Plymouth St SW Unit 9
- 723 Thomas St SW
- 1501 8th Ave SW
- 1405 8th Ave SW
- 1510 8th Ave SW
- 809 Thomas St SW
- 1509 7th Ave SW
- 809 Plymouth St SW
- 1322 8th Ave SW
- 716 Plymouth St SW
- 816 Thomas St SW
- 710 Plymouth St SW