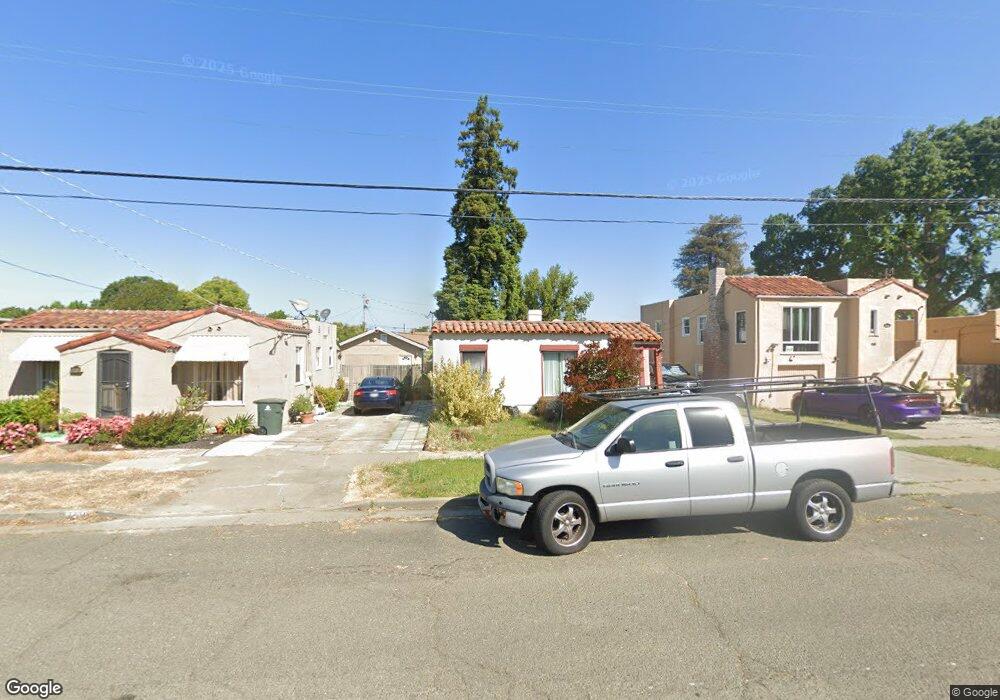
1414 Beach St Vallejo, CA 94590
West Vallejo NeighborhoodEstimated Value: $349,000 - $422,000
2
Beds
1
Bath
798
Sq Ft
$489/Sq Ft
Est. Value
About This Home
This home is located at 1414 Beach St, Vallejo, CA 94590 and is currently estimated at $389,859, approximately $488 per square foot. 1414 Beach St is a home located in Solano County with nearby schools including Steffan Manor Elementary, Vallejo High School, and Mustard Seed Preschool and Kindergarten.
Ownership History
Date
Name
Owned For
Owner Type
Purchase Details
Closed on
Aug 13, 2001
Sold by
Tipp Mary E and Tipp David J
Bought by
Sutton Kevin M
Current Estimated Value
Home Financials for this Owner
Home Financials are based on the most recent Mortgage that was taken out on this home.
Original Mortgage
$149,900
Outstanding Balance
$58,643
Interest Rate
7.19%
Estimated Equity
$331,216
Purchase Details
Closed on
Jan 24, 1994
Sold by
Camden Jayne I
Bought by
Camden Jayne I
Create a Home Valuation Report for This Property
The Home Valuation Report is an in-depth analysis detailing your home's value as well as a comparison with similar homes in the area
Home Values in the Area
Average Home Value in this Area
Purchase History
We collect this data history from publicly available records. To have your information removed, we recommend requesting removal directly through your county’s website.
| Date | Buyer | Sale Price | Title Company |
|---|---|---|---|
| Sutton Kevin M | $158,000 | Fidelity National Title Co | |
| Camden Jayne I | -- | -- |
Source: Public Records
Mortgage History
We collect this data history from publicly available records. To have your information removed, we recommend requesting removal directly through your county’s website.
| Date | Status | Borrower | Loan Amount |
|---|---|---|---|
| Open | Sutton Kevin M | $149,900 |
Source: Public Records
Tax History
| Year | Tax Paid | Tax Assessment Tax Assessment Total Assessment is a certain percentage of the fair market value that is determined by local assessors to be the total taxable value of land and additions on the property. | Land | Improvement |
|---|---|---|---|---|
| 2025 | $3,716 | $233,107 | $59,085 | $174,022 |
| 2024 | $3,716 | $228,537 | $57,927 | $170,610 |
| 2023 | $3,484 | $224,057 | $56,792 | $167,265 |
| 2022 | $3,385 | $219,665 | $55,679 | $163,986 |
| 2021 | $3,310 | $215,359 | $54,588 | $160,771 |
| 2020 | $3,316 | $213,152 | $54,029 | $159,123 |
| 2019 | $3,208 | $208,973 | $52,970 | $156,003 |
| 2018 | $2,998 | $204,877 | $51,932 | $152,945 |
| 2017 | $2,857 | $200,861 | $50,914 | $149,947 |
| 2016 | $2,287 | $196,923 | $49,916 | $147,007 |
| 2015 | $1,893 | $162,000 | $39,000 | $123,000 |
| 2014 | $1,858 | $158,000 | $38,000 | $120,000 |
Source: Public Records
Map
Nearby Homes
- 1430 Beach St
- 1426 Beach St
- 1435 Farrell St
- 1422 Beach St
- 1439 Farrell St
- 1427 Farrell St
- 105 Campbell Ave
- 302 Wallace Ave
- 1423 Farrell St
- 109 Campbell Ave
- 1419 Farrell St
- 306 Wallace Ave
- 1410 Beach St
- 1427 Beach St
- 115 Campbell Ave
- 100 Campbell Ave
- 1421 Beach St
- 1405 Farrell St
- 308 Wallace Ave
- 220 Wallace Ave
Your Personal Tour Guide
Ask me questions while you tour the home.