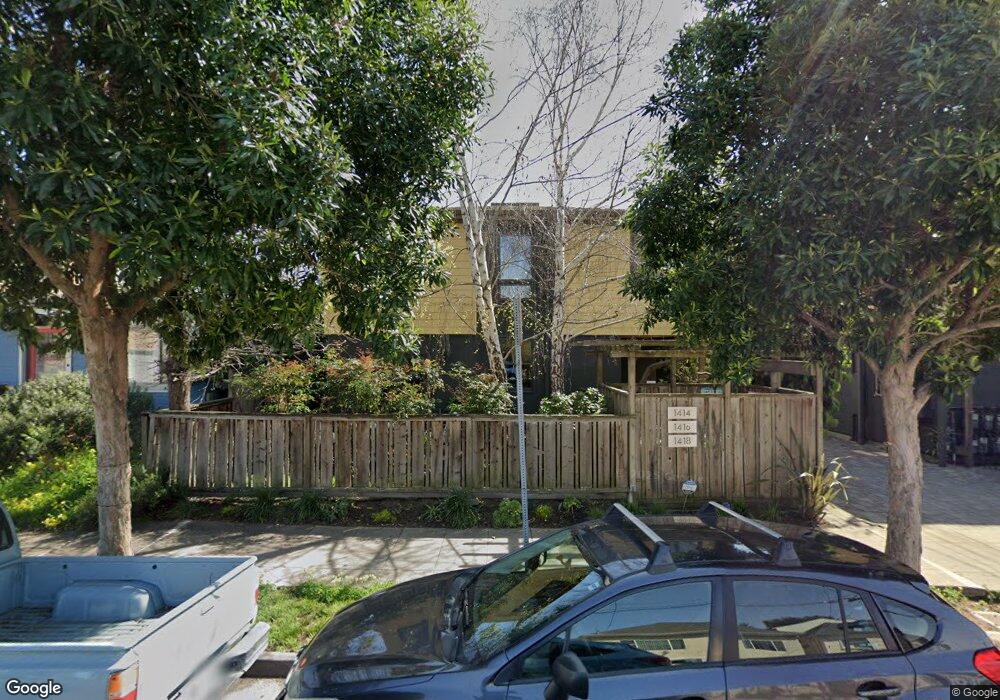
1414 Harmon St Unit 1418B Berkeley, CA 94702
West Berkeley NeighborhoodEstimated Value: $799,000 - $1,126,000
2
Beds
3
Baths
1,300
Sq Ft
$707/Sq Ft
Est. Value
About This Home
This home is located at 1414 Harmon St Unit 1418B, Berkeley, CA 94702 and is currently estimated at $918,481, approximately $706 per square foot. 1414 Harmon St Unit 1418B is a home located in Alameda County with nearby schools including Malcolm X Elementary School, Washington Elementary School, and Oxford Elementary School.
Ownership History
Date
Name
Owned For
Owner Type
Purchase Details
Closed on
Apr 11, 2020
Sold by
Steif Daniel and Lozada Nathania
Bought by
Steif Daniel and Lozada Nathania Aileen
Current Estimated Value
Purchase Details
Closed on
Aug 18, 2015
Sold by
Chow Joseph F and Chow Hilda L
Bought by
Steif Daniel and Lozada Nathania
Home Financials for this Owner
Home Financials are based on the most recent Mortgage that was taken out on this home.
Original Mortgage
$560,000
Outstanding Balance
$437,875
Interest Rate
3.86%
Mortgage Type
New Conventional
Estimated Equity
$480,606
Purchase Details
Closed on
Jul 26, 2013
Sold by
Chow Joseph F and Chow Hilda L
Bought by
Chow Joseph F and Chow Hilda L
Purchase Details
Closed on
Jun 28, 2007
Sold by
Ideal Design Investment Group Llc
Bought by
Chow Joseph and Chow Hilda
Create a Home Valuation Report for This Property
The Home Valuation Report is an in-depth analysis detailing your home's value as well as a comparison with similar homes in the area
Home Values in the Area
Average Home Value in this Area
Purchase History
| Date | Buyer | Sale Price | Title Company |
|---|---|---|---|
| Steif Daniel | -- | None Available | |
| Steif Daniel | $700,000 | Placer Title Company | |
| Chow Joseph F | -- | None Available | |
| Chow Joseph | $550,000 | Old Republic Title Company |
Source: Public Records
Mortgage History
| Date | Status | Borrower | Loan Amount |
|---|---|---|---|
| Open | Steif Daniel | $560,000 | |
| Closed | Chow Joseph | -- |
Source: Public Records
Tax History
| Year | Tax Paid | Tax Assessment Tax Assessment Total Assessment is a certain percentage of the fair market value that is determined by local assessors to be the total taxable value of land and additions on the property. | Land | Improvement |
|---|---|---|---|---|
| 2025 | $12,164 | $828,638 | $248,591 | $580,047 |
| 2024 | $12,164 | $812,391 | $243,717 | $568,674 |
| 2023 | $11,918 | $796,466 | $238,940 | $557,526 |
| 2022 | $11,719 | $780,850 | $234,255 | $546,595 |
| 2021 | $11,756 | $765,540 | $229,662 | $535,878 |
| 2020 | $11,079 | $757,693 | $227,308 | $530,385 |
| 2019 | $10,681 | $742,840 | $222,852 | $519,988 |
| 2018 | $10,510 | $728,280 | $218,484 | $509,796 |
| 2017 | $10,146 | $714,000 | $214,200 | $499,800 |
| 2016 | $9,846 | $700,000 | $210,000 | $490,000 |
| 2015 | $8,723 | $601,088 | $180,326 | $420,762 |
| 2014 | $7,681 | $510,000 | $153,000 | $357,000 |
Source: Public Records
Map
Nearby Homes
- 3224 Sacramento St
- 968 62nd St
- 3214 California St
- 3138 California St
- 3101 Sacramento St
- 3114 California St
- 3110 California St
- 1507 Prince St
- 1036 60th St
- 6500 San Pablo Ave
- 1080 67th St
- 3032 Mabel St
- 6015 Adeline St
- 3233 Ellis St
- 6465 San Pablo Ave Unit 306
- 6465 San Pablo Ave Unit 203
- 1124 63rd St
- 6501 San Pablo Ave Unit 410
- 1126 Ocean Ave
- 1314 Ashby Ave
- 1414 Harmon St Unit C
- 1414 Harmon St Unit 1418A
- 1414 Harmon St Unit 1416B
- 1414 Harmon St Unit 1414C
- 1414 Harmon St
- 1414 Harmon St Unit 1414A
- 1416 Harmon St
- 1418 Harmon St Unit A
- 1418 Harmon St
- 1412 Harmon St
- 1420 Harmon St
- 1408 Harmon St
- 1424 Harmon St
- 1404 Harmon St
- 1415 Alcatraz Ave
- 1413 Alcatraz Ave
- 1430 Harmon St
- 1417 Alcatraz Ave
- 1423 Alcatraz Ave
- 3235 Baker St
Your Personal Tour Guide
Ask me questions while you tour the home.