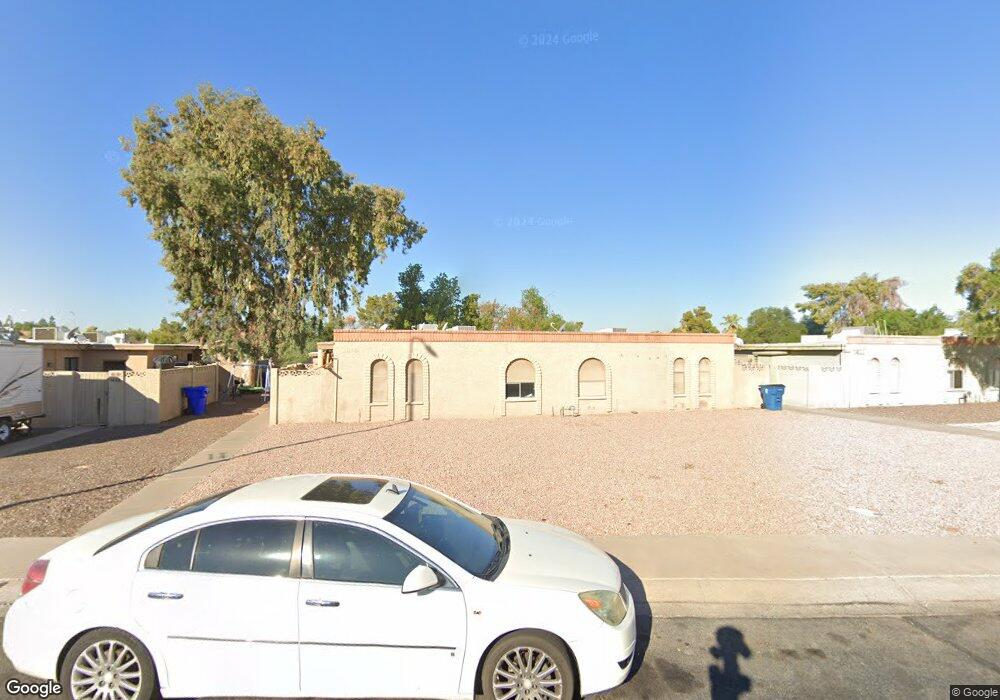
1414 N Evergreen St Chandler, AZ 85225
North Chandler NeighborhoodEstimated Value: $650,046 - $909,000
--
Bed
--
Bath
2,808
Sq Ft
$286/Sq Ft
Est. Value
About This Home
This home is located at 1414 N Evergreen St, Chandler, AZ 85225 and is currently estimated at $803,012, approximately $285 per square foot. 1414 N Evergreen St is a home located in Maricopa County with nearby schools including Andersen Elementary School, Andersen Junior High School, and Chandler High School.
Ownership History
Date
Name
Owned For
Owner Type
Purchase Details
Closed on
Jul 23, 2018
Sold by
Lopez Cenobio and Lopez Nancy
Bought by
Lopez Cenobio A and Lopez Nancy P
Current Estimated Value
Purchase Details
Closed on
Oct 22, 2007
Sold by
Ingram Gary R and Gonzalez Maria R
Bought by
Lopez Nancy and Lopez Cenobio
Home Financials for this Owner
Home Financials are based on the most recent Mortgage that was taken out on this home.
Original Mortgage
$241,250
Interest Rate
6.15%
Mortgage Type
New Conventional
Purchase Details
Closed on
May 23, 2003
Sold by
Gray Patricia A
Bought by
Ingram Gary R and Gonzalez Maria R
Home Financials for this Owner
Home Financials are based on the most recent Mortgage that was taken out on this home.
Original Mortgage
$232,000
Interest Rate
5.75%
Mortgage Type
New Conventional
Purchase Details
Closed on
Aug 2, 2002
Sold by
C & L Iv Lc
Bought by
Gray Patricia A
Create a Home Valuation Report for This Property
The Home Valuation Report is an in-depth analysis detailing your home's value as well as a comparison with similar homes in the area
Home Values in the Area
Average Home Value in this Area
Purchase History
| Date | Buyer | Sale Price | Title Company |
|---|---|---|---|
| Lopez Cenobio A | -- | None Available | |
| Lopez Nancy | $345,000 | Intracoastal Title Agency Ll | |
| Ingram Gary R | $293,000 | Capital Title Agency Inc | |
| Gray Patricia A | $280,000 | Chicago Title Insurance Co |
Source: Public Records
Mortgage History
| Date | Status | Borrower | Loan Amount |
|---|---|---|---|
| Previous Owner | Lopez Nancy | $241,250 | |
| Previous Owner | Ingram Gary R | $232,000 |
Source: Public Records
Tax History Compared to Growth
Tax History
| Year | Tax Paid | Tax Assessment Tax Assessment Total Assessment is a certain percentage of the fair market value that is determined by local assessors to be the total taxable value of land and additions on the property. | Land | Improvement |
|---|---|---|---|---|
| 2025 | $1,580 | $16,894 | -- | -- |
| 2024 | $1,525 | $16,089 | -- | -- |
| 2023 | $1,525 | $48,850 | $9,770 | $39,080 |
| 2022 | $1,477 | $40,680 | $8,130 | $32,550 |
| 2021 | $1,518 | $33,720 | $6,740 | $26,980 |
| 2020 | $1,509 | $27,100 | $5,420 | $21,680 |
| 2019 | $1,456 | $23,060 | $4,610 | $18,450 |
| 2018 | $1,415 | $19,250 | $3,850 | $15,400 |
| 2017 | $1,329 | $18,900 | $3,780 | $15,120 |
| 2016 | $1,284 | $16,470 | $3,290 | $13,180 |
| 2015 | $1,231 | $15,450 | $3,090 | $12,360 |
Source: Public Records
Map
Nearby Homes
- 728 W Calle Del Norte
- 1381 N Alma School Rd
- 1351 N Pleasant Dr Unit 1108
- 1351 N Pleasant Dr Unit 2115
- 1351 N Pleasant Dr Unit 1102
- 1351 N Pleasant Dr Unit 1074
- 1351 N Pleasant Dr Unit 1016
- 1505 N Evergreen St Unit 17
- 1505 N Evergreen St Unit 42
- 1580 N Sunset Place
- 1419 N Vine St
- 1520 N Hartford St
- 1621 N Chippewa Dr
- 1287 N Alma School Rd Unit 210
- 1287 N Alma School Rd Unit 156
- 1714 N Pleasant Dr
- 1121 W Manor St
- 555 W Warner Rd Unit 127
- 555 W Warner Rd Unit 139
- 555 W Warner Rd Unit 156
- 1414 N Evergreen St Unit 1-4
- 1414 N Evergreen St Unit 3
- 1414 N Evergreen St Unit 4
- 1420 N Evergreen St Unit 2
- 1420 N Evergreen St Unit 4
- 1420 N Evergreen St Unit 3
- 1420 N Evergreen St
- 1408 N Evergreen St
- 1413 N Jay St
- 800 W Knox Rd
- 1419 N Jay St
- 1415 N Jay St
- 1407 N Jay St
- 1417 N Jay St
- 1409 N Evergreen St
- 1450 N Evergreen St
- 1415 N Evergreen St Unit 5
- 1415 N Evergreen St Unit 4
- 1415 N Evergreen St
- 1409 N Jay St