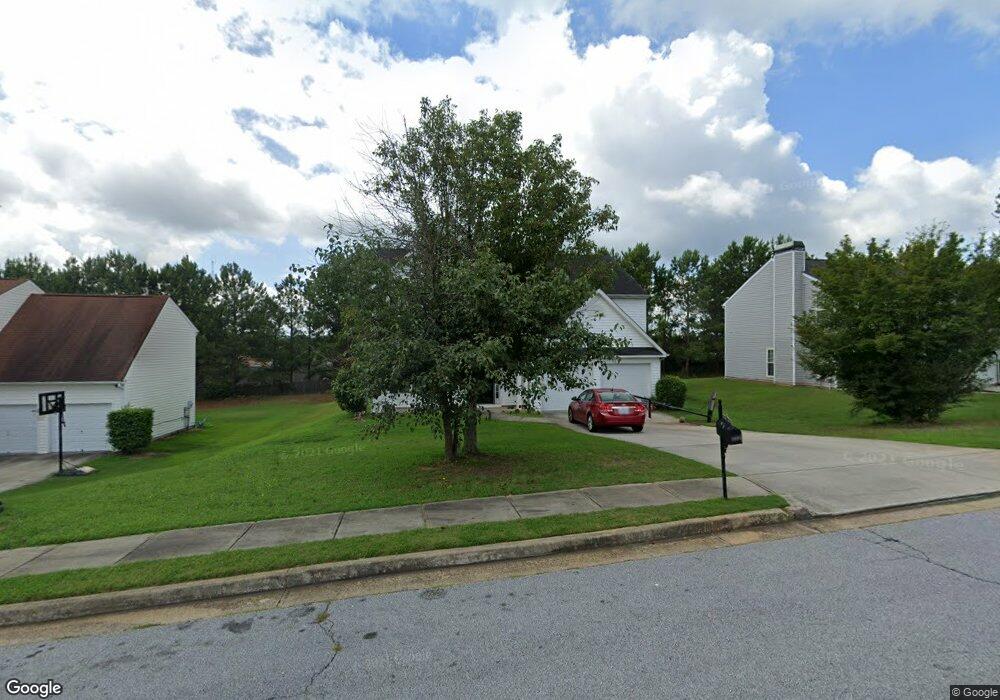
1415 Buckingham Ct Hampton, GA 30228
Estimated Value: $245,694 - $282,000
4
Beds
3
Baths
1,940
Sq Ft
$136/Sq Ft
Est. Value
About This Home
This home is located at 1415 Buckingham Ct, Hampton, GA 30228 and is currently estimated at $263,674, approximately $135 per square foot. 1415 Buckingham Ct is a home located in Clayton County with nearby schools including Kemp Primary School, Kemp Elementary School, and Eddie White Academy.
Ownership History
Date
Name
Owned For
Owner Type
Purchase Details
Closed on
Nov 17, 2006
Sold by
Coleman Joe L
Bought by
Gardner Zamonka
Current Estimated Value
Home Financials for this Owner
Home Financials are based on the most recent Mortgage that was taken out on this home.
Original Mortgage
$165,000
Outstanding Balance
$97,241
Interest Rate
6.33%
Mortgage Type
New Conventional
Estimated Equity
$166,433
Purchase Details
Closed on
Nov 23, 2005
Sold by
Mitchell Billy
Bought by
Coleman Joe L
Home Financials for this Owner
Home Financials are based on the most recent Mortgage that was taken out on this home.
Original Mortgage
$121,384
Interest Rate
6.23%
Mortgage Type
New Conventional
Purchase Details
Closed on
May 28, 1999
Sold by
Dr Horton Inc - Torrey
Bought by
Mitchell Billy
Home Financials for this Owner
Home Financials are based on the most recent Mortgage that was taken out on this home.
Original Mortgage
$125,550
Interest Rate
7.7%
Mortgage Type
FHA
Create a Home Valuation Report for This Property
The Home Valuation Report is an in-depth analysis detailing your home's value as well as a comparison with similar homes in the area
Home Values in the Area
Average Home Value in this Area
Purchase History
| Date | Buyer | Sale Price | Title Company |
|---|---|---|---|
| Gardner Zamonka | $165,000 | -- | |
| Coleman Joe L | $151,800 | -- | |
| Mitchell Billy | $126,700 | -- |
Source: Public Records
Mortgage History
| Date | Status | Borrower | Loan Amount |
|---|---|---|---|
| Open | Gardner Zamonka | $165,000 | |
| Previous Owner | Coleman Joe L | $121,384 | |
| Previous Owner | Mitchell Billy | $125,550 |
Source: Public Records
Tax History
| Year | Tax Paid | Tax Assessment Tax Assessment Total Assessment is a certain percentage of the fair market value that is determined by local assessors to be the total taxable value of land and additions on the property. | Land | Improvement |
|---|---|---|---|---|
| 2025 | $3,849 | $99,520 | $8,800 | $90,720 |
| 2024 | $3,981 | $101,080 | $8,800 | $92,280 |
| 2023 | $3,491 | $96,680 | $8,800 | $87,880 |
| 2022 | $3,364 | $84,760 | $8,800 | $75,960 |
| 2021 | $2,672 | $66,680 | $8,800 | $57,880 |
| 2020 | $2,431 | $59,820 | $8,800 | $51,020 |
| 2019 | $2,259 | $54,706 | $6,400 | $48,306 |
| 2018 | $1,969 | $47,569 | $6,400 | $41,169 |
| 2017 | $1,644 | $39,479 | $6,400 | $33,079 |
| 2016 | $1,680 | $40,350 | $6,400 | $33,950 |
| 2015 | $1,652 | $0 | $0 | $0 |
| 2014 | $1,036 | $25,084 | $6,400 | $18,684 |
Source: Public Records
Map
Nearby Homes
- 10897 Paladin Dr
- 1578 Pintail Rd
- 10571 Starling Trail Unit II
- 10664 Sandpiper Rd
- 10725 Barberry Dr Unit 5
- 1605 Plover Rd
- 10617 Barberry Dr
- 1350 Birdsong Ln
- 10747 Thrasher Rd
- 1278 Lynx Ct
- 1429 Trellis Ct Unit (LOT 9)
- 1429 Trellis Ct
- 1441 Trellis Ct
- 1441 Trellis Ct Unit (LOT 7)
- 1432 Shadow Creek Ave
- 1416 Trellis Ct
- 1428 Trellis Ct Unit (LOT 23)
- 1428 Trellis Ct
- 1434 Trellis Ct
- 1434 Trellis Ct Unit (LOT 24)
- 1407 Buckingham Ct Unit IV
- 1423 Buckingham Ct
- 1418 Hyde Ct Unit V
- 1426 Hyde Ct
- 1426 Hyde Ct Unit V
- 1410 Hyde Ct
- 1399 Buckingham Ct
- 1431 Buckingham Ct
- 1431 Buckingham Ct Unit IV
- 10714 Buckingham Cir
- 1400 Buckingham Ct
- 1434 Hyde Ct
- 1402 Hyde Ct
- 1391 Buckingham Ct Unit IV
- 10741 Paladin Dr Unit IV
- 10749 Paladin Dr
- 10706 Buckingham Cir
- 1392 Buckingham Ct
- 10729 Paladin Dr Unit IV
- 10757 Paladin Dr Unit V
Your Personal Tour Guide
Ask me questions while you tour the home.