1415 Farnam St Unit 1/2 Davenport, IA 52803
Central Davenport NeighborhoodEstimated Value: $112,000 - $151,000
3
Beds
2
Baths
2,260
Sq Ft
$59/Sq Ft
Est. Value
About This Home
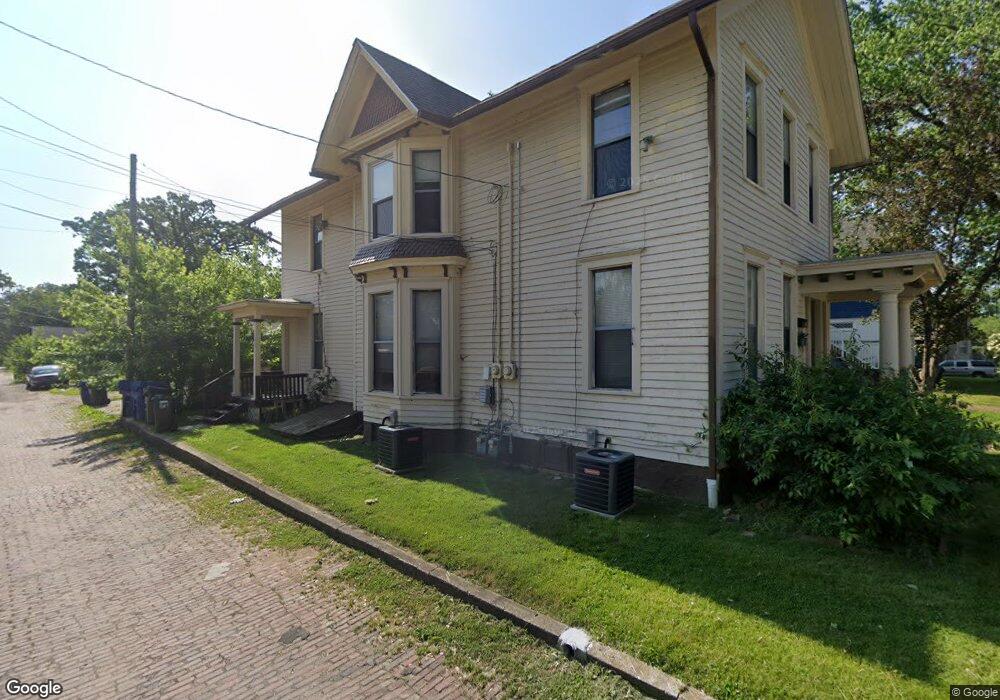
This home is located at 1415 Farnam St Unit 1/2, Davenport, IA 52803 and is currently estimated at $132,924, approximately $58 per square foot. 1415 Farnam St Unit 1/2 is a home located in Scott County with nearby schools including Crofton Elementary School, Casey County Middle School, and Hopkinsville Middle School.
Ownership History
Date
Name
Owned For
Owner Type
Purchase Details
Closed on
Jun 11, 2021
Sold by
Hwc Homes Llc
Bought by
1415 Farnam St Davenport Trust and Property Privacy Services
Current Estimated Value
Purchase Details
Closed on
Feb 15, 2021
Sold by
Top Notch Real Estate Llc
Bought by
Hwc Homes Llc
Home Financials for this Owner
Home Financials are based on the most recent Mortgage that was taken out on this home.
Original Mortgage
$110,000
Interest Rate
2.65%
Mortgage Type
New Conventional
Purchase Details
Closed on
Oct 4, 2010
Sold by
Wickett Theresa A and Wickett Theresa Ann
Bought by
Wickett Shane Michael
Purchase Details
Closed on
Nov 8, 2005
Sold by
Wherry Ross W and Kerfoot Donna R
Bought by
Wickett Shane M and Wickett Theresa A
Create a Home Valuation Report for This Property
The Home Valuation Report is an in-depth analysis detailing your home's value as well as a comparison with similar homes in the area
Home Values in the Area
Average Home Value in this Area
Purchase History
| Date | Buyer | Sale Price | Title Company |
|---|---|---|---|
| 1415 Farnam St Davenport Trust | -- | None Listed On Document | |
| Hwc Homes Llc | -- | None Listed On Document | |
| Wickett Shane Michael | -- | None Available | |
| Wickett Shane M | $73,900 | None Available |
Source: Public Records
Mortgage History
| Date | Status | Borrower | Loan Amount |
|---|---|---|---|
| Previous Owner | Hwc Homes Llc | $110,000 | |
| Closed | Wickett Shane M | $0 |
Source: Public Records
Tax History Compared to Growth
Tax History
| Year | Tax Paid | Tax Assessment Tax Assessment Total Assessment is a certain percentage of the fair market value that is determined by local assessors to be the total taxable value of land and additions on the property. | Land | Improvement |
|---|---|---|---|---|
| 2025 | $1,792 | $113,270 | $10,680 | $102,590 |
| 2024 | $1,748 | $100,250 | $10,680 | $89,570 |
| 2023 | $2,477 | $100,250 | $10,680 | $89,570 |
| 2022 | $1,742 | $102,980 | $5,800 | $97,180 |
| 2021 | $1,742 | $81,210 | $5,800 | $75,410 |
| 2020 | $1,527 | $61,810 | $5,800 | $56,010 |
| 2019 | $2,075 | $53,810 | $5,800 | $48,010 |
| 2018 | $1,772 | $53,810 | $5,800 | $48,010 |
| 2017 | $299 | $53,810 | $5,800 | $48,010 |
| 2016 | $1,661 | $51,280 | $0 | $0 |
| 2015 | $1,124 | $50,440 | $0 | $0 |
| 2014 | $1,120 | $50,440 | $0 | $0 |
| 2013 | $1,100 | $0 | $0 | $0 |
| 2012 | -- | $61,140 | $5,920 | $55,220 |
Source: Public Records
Map
Nearby Homes
- 409 E 14th St
- 1215 Farnam St
- 407 E 14th St
- 637 E 15th St
- 511 Kirkwood Blvd
- 320 E 14th St
- 420 Kirkwood Blvd
- 325 Kirkwood Blvd
- 1222 Pershing Ave
- 618 Douglas Ct
- 209 E 13th St
- 230 Kirkwood Blvd
- 1605 Arlington Ave
- 914 Farnam St
- 916 Kirkwood Blvd
- 1134 Tremont Ave
- 1812 Pershing Ave
- 1020 E 15th St
- 413 E 9th St
- 1321 N Main St
- 602 E 14th St
- 608 E 14th St
- 601 E 15th St
- 614 E 14th St
- 615 E 15th St
- 1416 Farnam St
- 620 E 14th St
- 1422 Farnam St
- 619 E 15th St
- 1408 Farnam St
- 531 E 15th St
- 531 E 15th St Unit 2
- 531 E 15th St Unit 1
- 531 E 15th St Unit 2
- 531 E 15th St Unit 1
- 529 E 15th St
- 621 E 15th St
- 630 E 14th St
- 521 E 15th St
- 607 E 14th St