1415 Graceland Ave Findlay, OH 45840
Estimated Value: $195,000 - $229,000
3
Beds
3
Baths
1,440
Sq Ft
$148/Sq Ft
Est. Value
About This Home
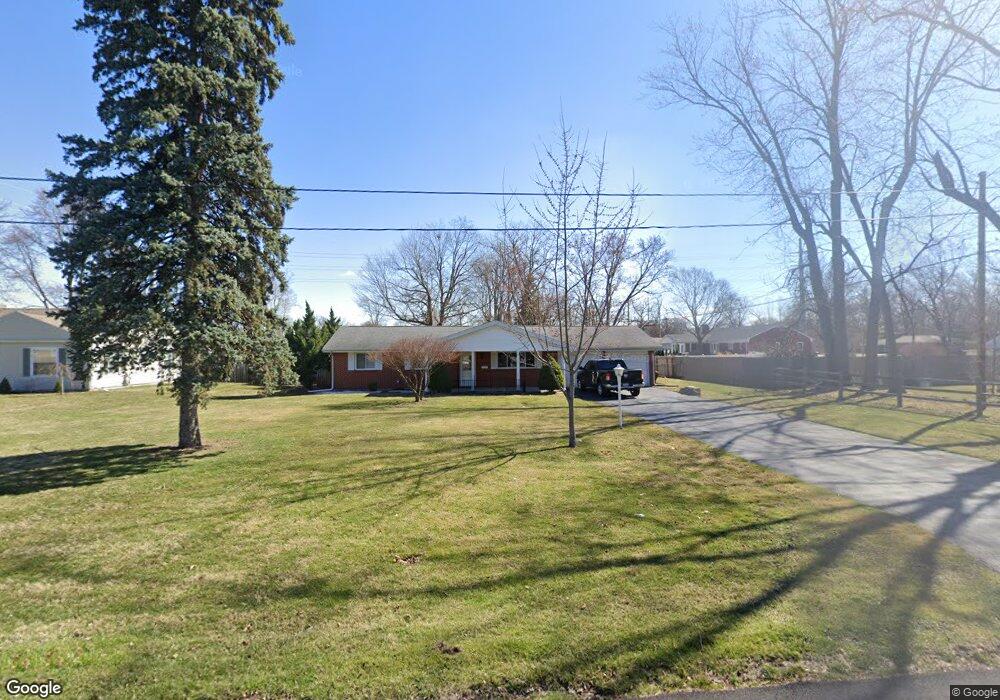
This home is located at 1415 Graceland Ave, Findlay, OH 45840 and is currently estimated at $213,149, approximately $148 per square foot. 1415 Graceland Ave is a home located in Hancock County with nearby schools including Whittier Elementary School, Wilson Vance Elementary School, and Donnell Middle School.
Ownership History
Date
Name
Owned For
Owner Type
Purchase Details
Closed on
Dec 27, 2013
Sold by
Ballmer Benjamin John and Ballmer Sarah E
Bought by
Smith Joshua M and Smith Megan Hollywood
Current Estimated Value
Home Financials for this Owner
Home Financials are based on the most recent Mortgage that was taken out on this home.
Original Mortgage
$106,534
Outstanding Balance
$79,993
Interest Rate
4.25%
Mortgage Type
FHA
Estimated Equity
$133,156
Purchase Details
Closed on
Jun 12, 2009
Sold by
Reinhart Joseph M and Theis Rita
Bought by
Ballmer Benjamin John and Ballmer Sarah E
Home Financials for this Owner
Home Financials are based on the most recent Mortgage that was taken out on this home.
Original Mortgage
$98,090
Interest Rate
4.85%
Mortgage Type
FHA
Purchase Details
Closed on
Jul 27, 1993
Bought by
Reinhart Joseph M and Reinhart Lydia
Create a Home Valuation Report for This Property
The Home Valuation Report is an in-depth analysis detailing your home's value as well as a comparison with similar homes in the area
Home Values in the Area
Average Home Value in this Area
Purchase History
| Date | Buyer | Sale Price | Title Company |
|---|---|---|---|
| Smith Joshua M | $108,500 | Assured Title | |
| Ballmer Benjamin John | $99,900 | Mid American Title Agency | |
| Reinhart Joseph M | -- | -- |
Source: Public Records
Mortgage History
| Date | Status | Borrower | Loan Amount |
|---|---|---|---|
| Open | Smith Joshua M | $106,534 | |
| Previous Owner | Ballmer Benjamin John | $98,090 |
Source: Public Records
Tax History Compared to Growth
Tax History
| Year | Tax Paid | Tax Assessment Tax Assessment Total Assessment is a certain percentage of the fair market value that is determined by local assessors to be the total taxable value of land and additions on the property. | Land | Improvement |
|---|---|---|---|---|
| 2024 | $1,890 | $53,210 | $9,070 | $44,140 |
| 2023 | $1,893 | $53,210 | $9,070 | $44,140 |
| 2022 | $1,886 | $53,210 | $9,070 | $44,140 |
| 2021 | $1,633 | $40,130 | $10,630 | $29,500 |
| 2020 | $1,633 | $40,130 | $10,630 | $29,500 |
| 2019 | $1,600 | $40,130 | $10,630 | $29,500 |
| 2018 | $1,721 | $39,550 | $10,630 | $28,920 |
| 2017 | $860 | $39,550 | $10,630 | $28,920 |
| 2016 | $1,669 | $38,830 | $9,910 | $28,920 |
| 2015 | $1,815 | $41,500 | $9,910 | $31,590 |
| 2014 | $1,815 | $41,500 | $9,910 | $31,590 |
| 2012 | $1,830 | $41,500 | $9,910 | $31,590 |
Source: Public Records
Map
Nearby Homes
- 804 6th St
- 1008 Eastview Dr
- 1011 Stall Dr
- 1709 Eastview Dr
- 1726 Eastview Dr
- 1200 5th St
- 1109 Park St
- 1727 Washington Ave
- 1109 Brookside Dr
- 1006 Selby St
- 1301 Fishlock Ave
- 0 Blanchard Ave
- 420 1st St
- 211 Fairlawn Place
- 123 Glendale Ave
- 1037 Fishlock Ave
- 1621 S Main St
- 820 Selby St
- 1705 S Main St
- 1802 Lippincott Ave