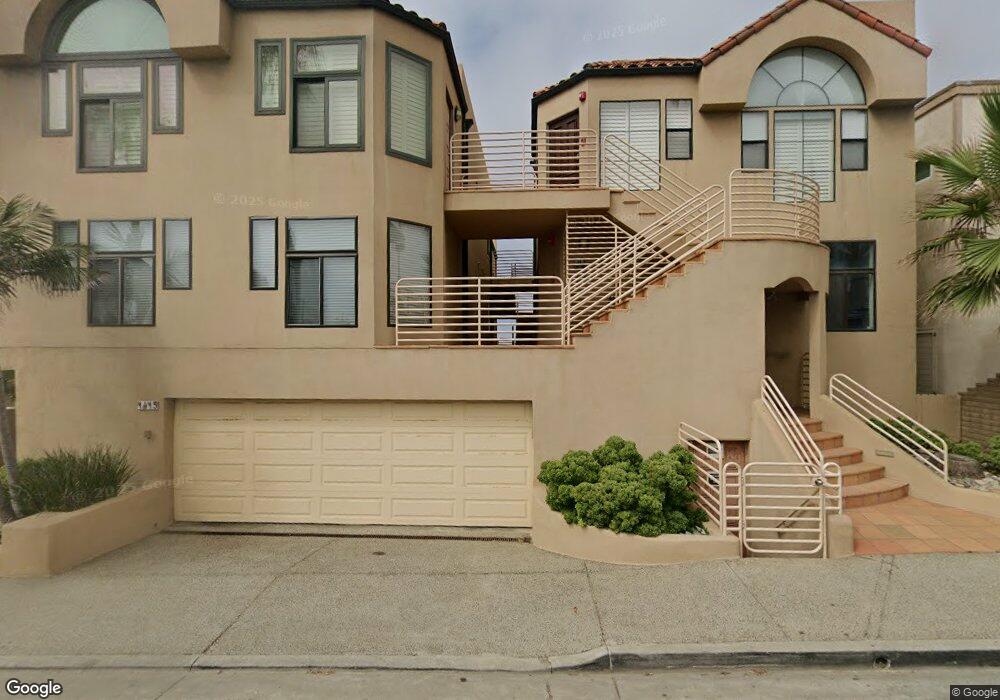
1415 S Pacific St Unit 202 Oceanside, CA 92054
Downtown Oceanside NeighborhoodEstimated Value: $1,227,000 - $2,015,000
3
Beds
2
Baths
1,632
Sq Ft
$1,021/Sq Ft
Est. Value
About This Home
This home is located at 1415 S Pacific St Unit 202, Oceanside, CA 92054 and is currently estimated at $1,665,839, approximately $1,020 per square foot. 1415 S Pacific St Unit 202 is a home located in San Diego County with nearby schools including South Oceanside Elementary School, Lincoln Middle School, and Oceanside High School.
Ownership History
Date
Name
Owned For
Owner Type
Purchase Details
Closed on
Jan 31, 2011
Sold by
Derganc Steven A and Derganc Patricia D
Bought by
Derganc Steven A and Derganc Patricia D
Current Estimated Value
Purchase Details
Closed on
Jun 28, 1999
Sold by
Derganc Steven Derganc Stanley G
Bought by
Derganc Steven A and Derganc Patricia D
Home Financials for this Owner
Home Financials are based on the most recent Mortgage that was taken out on this home.
Original Mortgage
$350,000
Outstanding Balance
$95,639
Interest Rate
7.25%
Estimated Equity
$1,570,200
Purchase Details
Closed on
Jun 19, 1997
Sold by
Residential Funding Corp
Bought by
Derganc Stanley G and Derganc Evelynn J
Home Financials for this Owner
Home Financials are based on the most recent Mortgage that was taken out on this home.
Original Mortgage
$345,600
Interest Rate
8%
Purchase Details
Closed on
Feb 14, 1997
Sold by
Mccollum Rose I
Bought by
The First National Bank Of Chicago
Purchase Details
Closed on
Sep 21, 1989
Create a Home Valuation Report for This Property
The Home Valuation Report is an in-depth analysis detailing your home's value as well as a comparison with similar homes in the area
Home Values in the Area
Average Home Value in this Area
Purchase History
| Date | Buyer | Sale Price | Title Company |
|---|---|---|---|
| Derganc Steven A | -- | None Available | |
| Derganc Steven A | -- | Fidelity National Title | |
| Derganc Stanley G | $432,000 | American Title Co | |
| The First National Bank Of Chicago | $400,000 | First American Title Ins Co | |
| -- | $699,500 | -- |
Source: Public Records
Mortgage History
| Date | Status | Borrower | Loan Amount |
|---|---|---|---|
| Open | Derganc Steven A | $350,000 | |
| Closed | Derganc Stanley G | $345,600 |
Source: Public Records
Tax History Compared to Growth
Tax History
| Year | Tax Paid | Tax Assessment Tax Assessment Total Assessment is a certain percentage of the fair market value that is determined by local assessors to be the total taxable value of land and additions on the property. | Land | Improvement |
|---|---|---|---|---|
| 2025 | $6,530 | $598,785 | $408,243 | $190,542 |
| 2024 | $6,530 | $587,045 | $400,239 | $186,806 |
| 2023 | $6,328 | $575,536 | $392,392 | $183,144 |
| 2022 | $6,231 | $564,252 | $384,699 | $179,553 |
| 2021 | $6,254 | $553,189 | $377,156 | $176,033 |
| 2020 | $6,060 | $547,517 | $373,289 | $174,228 |
| 2019 | $5,883 | $536,782 | $365,970 | $170,812 |
| 2018 | $5,819 | $526,258 | $358,795 | $167,463 |
| 2017 | $70 | $515,940 | $351,760 | $164,180 |
| 2016 | $5,525 | $505,824 | $344,863 | $160,961 |
| 2015 | $5,363 | $498,227 | $339,683 | $158,544 |
| 2014 | $5,154 | $488,469 | $333,030 | $155,439 |
Source: Public Records
Map
Nearby Homes
- 1409 S Pacific St
- 1401 S Pacific St Unit 205
- 1445 S Pacific St
- 1445 S Pacific St Unit I
- 1601 S Pacific St Unit 1B
- 1216 S Pacific St
- 1123-25 S Pacific St
- 1121 S Pacific St
- 1570 Vista Del Mar Way Unit 4
- 1573 Vista Del Mar Way
- 1125 S Cleveland St Unit 103
- 153 Sherri Ln
- 111 Sherri Ln
- 167 Sherri Ln
- 120 Sherri Ln
- Plan 6 at Tower 1888
- Plan 5 at Tower 1888
- Plan 4 at Tower 1888
- Plan 3 at Tower 1888
- Plan 2 at Tower 1888
- 1415 S Pacific St Unit 102
- 1415 S Pacific St
- 1415 S Pacific St Unit 201
- 1415 S Pacific St Unit 2L
- 1415 S Pacific St Unit 101
- 1419 S Pacific St
- 1413 S Pacific St
- 1413 S Pacific St Unit C
- 1413 S Pacific St Unit B
- 1413 S Pacific St Unit A
- 1421 S Pacific St
- 1409 S Pacific St Unit ID1248649P
- 1427 S Pacific St
- 1401 S Pacific St
- 1401 S Pacific St Unit 101
- 1401 S Pacific St Unit 102
- 1401 S Pacific St Unit 103
- 1401 S Pacific St Unit 104
- 1401 S Pacific St Unit 105
- 1401 S Pacific St Unit 202