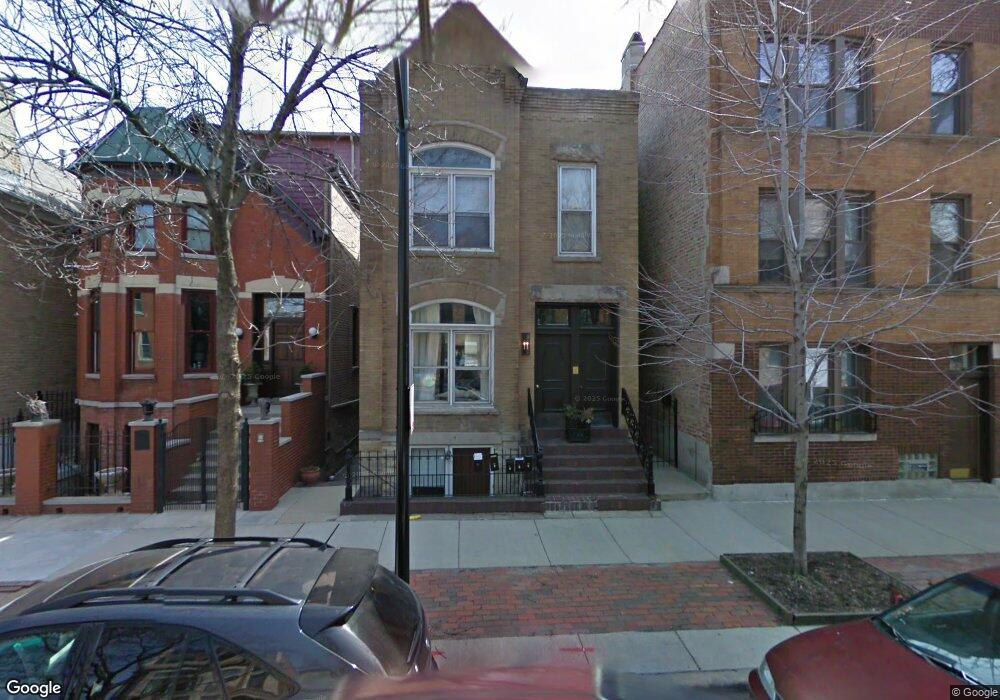
1415 W Lexington St Unit 1F Chicago, IL 60607
Little Italy NeighborhoodEstimated Value: $620,000 - $1,323,314
5
Beds
6
Baths
3,076
Sq Ft
$345/Sq Ft
Est. Value
About This Home
This home is located at 1415 W Lexington St Unit 1F, Chicago, IL 60607 and is currently estimated at $1,061,829, approximately $345 per square foot. 1415 W Lexington St Unit 1F is a home located in Cook County with nearby schools including John M. Smyth Elementary I.B. World School and Wells Community Academy High School.
Ownership History
Date
Name
Owned For
Owner Type
Purchase Details
Closed on
May 7, 2007
Sold by
Chicago Title Land Trust Co
Bought by
Weedon Jason A and Hrzic Danielle D
Current Estimated Value
Home Financials for this Owner
Home Financials are based on the most recent Mortgage that was taken out on this home.
Original Mortgage
$69,930
Outstanding Balance
$42,859
Interest Rate
6.22%
Mortgage Type
Credit Line Revolving
Estimated Equity
$1,018,970
Purchase Details
Closed on
Oct 9, 1997
Sold by
Swann Han Sangwan and Swann Han
Bought by
Lasalle National Bank and Trust #121180
Home Financials for this Owner
Home Financials are based on the most recent Mortgage that was taken out on this home.
Original Mortgage
$235,200
Interest Rate
7.7%
Mortgage Type
Commercial
Create a Home Valuation Report for This Property
The Home Valuation Report is an in-depth analysis detailing your home's value as well as a comparison with similar homes in the area
Home Values in the Area
Average Home Value in this Area
Purchase History
| Date | Buyer | Sale Price | Title Company |
|---|---|---|---|
| Weedon Jason A | $700,000 | Git | |
| Weedon Jason A | $700,000 | Git | |
| Lasalle National Bank | $196,000 | -- |
Source: Public Records
Mortgage History
| Date | Status | Borrower | Loan Amount |
|---|---|---|---|
| Open | Weedon Jason A | $69,930 | |
| Closed | Weedon Jason A | $69,930 | |
| Open | Weedon Jason A | $560,000 | |
| Closed | Weedon Jason A | $560,000 | |
| Previous Owner | Lasalle National Bank | $235,200 |
Source: Public Records
Tax History Compared to Growth
Tax History
| Year | Tax Paid | Tax Assessment Tax Assessment Total Assessment is a certain percentage of the fair market value that is determined by local assessors to be the total taxable value of land and additions on the property. | Land | Improvement |
|---|---|---|---|---|
| 2024 | $20,642 | $131,683 | $14,918 | $116,765 |
| 2023 | $2,474 | $97,500 | $11,988 | $85,512 |
| 2022 | $2,474 | $11,988 | $11,988 | $0 |
| 2021 | $18,519 | $91,791 | $11,988 | $79,803 |
| 2020 | $10,847 | $48,529 | $9,057 | $39,472 |
| 2019 | $10,992 | $54,528 | $9,057 | $45,471 |
| 2018 | $11,498 | $58,019 | $9,057 | $48,962 |
| 2017 | $13,873 | $64,222 | $7,992 | $56,230 |
| 2016 | $12,863 | $64,222 | $7,992 | $56,230 |
| 2015 | $11,768 | $64,222 | $7,992 | $56,230 |
| 2014 | $8,790 | $47,377 | $6,660 | $40,717 |
| 2013 | $9,923 | $54,557 | $6,660 | $47,897 |
Source: Public Records
Map
Nearby Homes
- 1439 W Lexington St
- 234 W Polk St Unit 3107
- 234 W Polk St Unit 3601
- 234 W Polk St Unit 3706
- 234 W Polk St Unit 2901
- 234 W Polk St Unit 2310
- 234 W Polk St Unit 3610
- 234 W Polk St Unit 2611
- 234 W Polk St Unit 2811
- 234 W Polk St Unit 3708
- 234 W Polk St Unit 3002
- 234 W Polk St Unit 3210
- 234 W Polk St Unit 3701
- 234 W Polk St Unit 2804
- 234 W Polk St Unit 2608
- 234 W Polk St Unit 2412
- 234 W Polk St Unit 3303
- 234 W Polk St Unit 2905
- 234 W Polk St Unit 2610
- 234 W Polk St Unit 3704
- 1415 W Lexington St
- 1421 W Lexington St
- 1419 W Lexington St
- 1413 W Lexington St
- 1457 W Lexington St Unit 2EAST
- 1423 W Lexington St
- 1411 W Lexington St Unit 1
- 1425 W Lexington St
- 736 S Loomis St
- 730 S Loomis St
- 730 S Loomis St Unit 2
- 730 S Loomis St Unit 3
- 732 S Loomis St Unit 3
- 732 S Loomis St Unit 1
- 734 S Loomis St
- 1418 W Polk St
- 1420 W Polk St
- 740 S Loomis St
- 1427 W Lexington St
- 1427 W Lexington St Unit 1 st. Floor