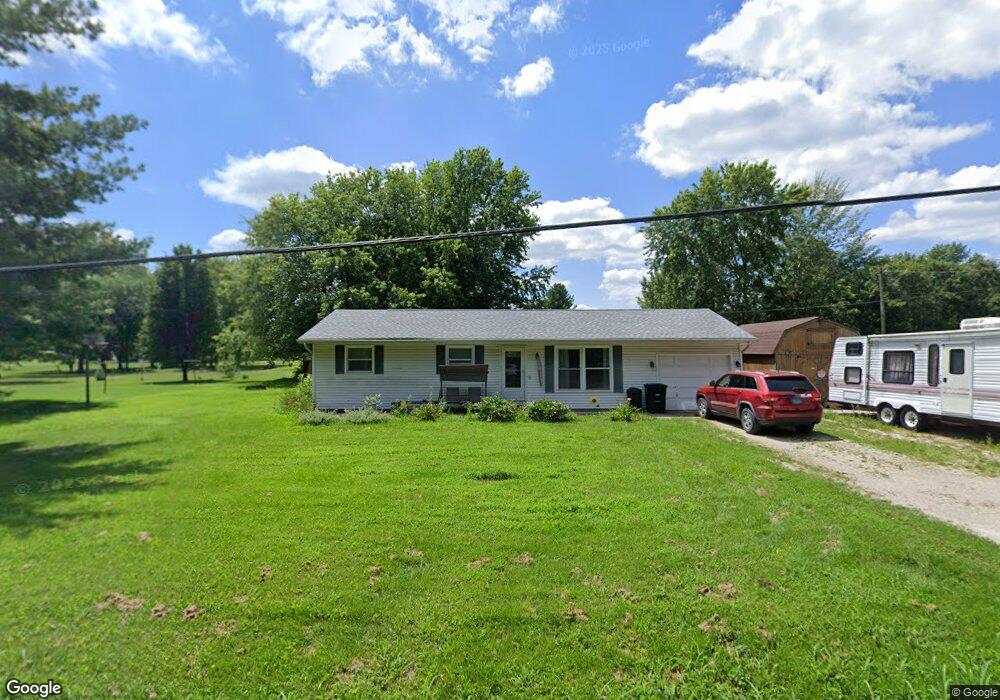
14151 N South Shore Dr Effingham, IL 62401
Estimated Value: $149,498 - $217,000
3
Beds
1
Bath
1,008
Sq Ft
$174/Sq Ft
Est. Value
About This Home
This home is located at 14151 N South Shore Dr, Effingham, IL 62401 and is currently estimated at $175,125, approximately $173 per square foot. 14151 N South Shore Dr is a home located in Effingham County with nearby schools including South Side Grade School, Early Learning Center, and Central Grade School.
Ownership History
Date
Name
Owned For
Owner Type
Purchase Details
Closed on
May 19, 2014
Sold by
Murrell Douglas A and Hester Janice L
Bought by
Cope Chantelle
Current Estimated Value
Home Financials for this Owner
Home Financials are based on the most recent Mortgage that was taken out on this home.
Original Mortgage
$79,527
Outstanding Balance
$63,449
Interest Rate
4.28%
Mortgage Type
USDA
Estimated Equity
$111,676
Purchase Details
Closed on
May 24, 2013
Sold by
Neeley Mel R
Bought by
Murrell Douglas A and Hester Janice L
Purchase Details
Closed on
Jun 30, 2006
Sold by
Leftwich Stephanie A
Bought by
Neeley Mel R
Home Financials for this Owner
Home Financials are based on the most recent Mortgage that was taken out on this home.
Original Mortgage
$18,000
Interest Rate
6.3%
Mortgage Type
New Conventional
Create a Home Valuation Report for This Property
The Home Valuation Report is an in-depth analysis detailing your home's value as well as a comparison with similar homes in the area
Home Values in the Area
Average Home Value in this Area
Purchase History
| Date | Buyer | Sale Price | Title Company |
|---|---|---|---|
| Cope Chantelle | $79,000 | None Available | |
| Murrell Douglas A | $64,000 | None Available | |
| Neeley Mel R | -- | None Available |
Source: Public Records
Mortgage History
| Date | Status | Borrower | Loan Amount |
|---|---|---|---|
| Open | Cope Chantelle | $79,527 | |
| Previous Owner | Neeley Mel R | $18,000 |
Source: Public Records
Tax History Compared to Growth
Tax History
| Year | Tax Paid | Tax Assessment Tax Assessment Total Assessment is a certain percentage of the fair market value that is determined by local assessors to be the total taxable value of land and additions on the property. | Land | Improvement |
|---|---|---|---|---|
| 2024 | $1,526 | $33,900 | $5,080 | $28,820 |
| 2023 | $1,394 | $30,680 | $4,600 | $26,080 |
| 2022 | $1,333 | $28,410 | $4,260 | $24,150 |
| 2021 | $1,252 | $27,060 | $4,060 | $23,000 |
| 2020 | $1,205 | $26,020 | $3,900 | $22,120 |
| 2019 | $1,174 | $25,270 | $3,790 | $21,480 |
| 2018 | $1,107 | $24,070 | $3,610 | $20,460 |
| 2017 | $1,075 | $23,600 | $3,540 | $20,060 |
| 2016 | $1,025 | $22,590 | $3,390 | $19,200 |
| 2015 | -- | $22,370 | $3,360 | $19,010 |
| 2014 | -- | $22,150 | $3,330 | $18,820 |
| 2013 | -- | $22,150 | $3,330 | $18,820 |
| 2012 | -- | $22,150 | $3,330 | $18,820 |
Source: Public Records
Map
Nearby Homes
- 8242 E Twin Oaks Dr
- 14689 N Court 6
- 15325 N Cardinal Ln
- 9284 E Court 11
- 15095 N Nees Ln
- 9219 E Best Ct
- 14744 N Court 1
- 14480 N 1025th St
- 14342 Sportsman's Dr
- 15872 N Bluebird Dr
- 24 N Country Club Rd
- 15243 N Holden Ave
- 13120 Augusta National Dr
- 21 N Country Club Rd
- 9 N Country Club Rd
- 8 N Country Club Rd
- 30 N Country Club Rd
- 12990 Country Club Rd
- 11107 E Cambridge Ln
- 15775 N Cobblestone Ct
- 14151 N Shore Dr
- 14177 N South Shore Dr
- 14177 N South Shore Dr
- 14166 N Romany Ln
- 14123 N South Shore Dr
- 14182 N Romany Ln
- 14 N South Shore Dr
- 14205 N South Shore Dr
- 13 N South Shore Dr
- 14121 N Romany Ln
- 14134 N South Shore Dr
- 14063 N South Shore Dr
- 14186 N South Shore Dr
- 14233 N South Shore Dr
- 14233 N South Shore Dr
- 14090 N South Shore Dr
- 9 E Chinquapin Ave
- 12 N South Shore Dr
- 14226 N Romany Ln
- 14085 N Romany Ln