Estimated Value: $674,000 - $1,233,000
2
Beds
1
Bath
600
Sq Ft
$1,587/Sq Ft
Est. Value
About This Home
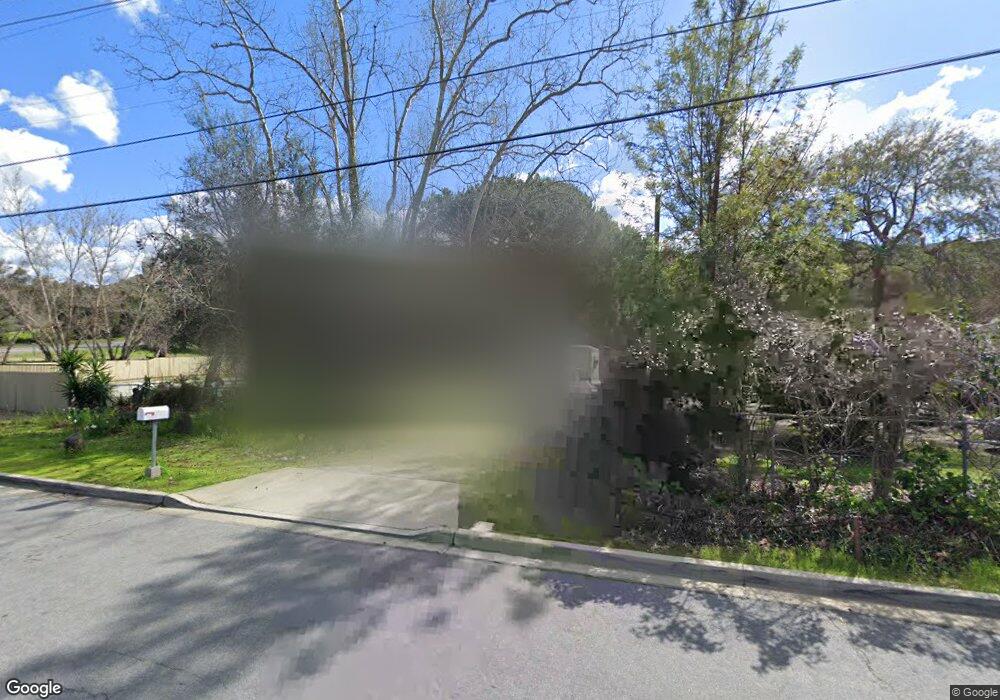
This home is located at 14153 Ezra Ln, Poway, CA 92064 and is currently estimated at $952,033, approximately $1,586 per square foot. 14153 Ezra Ln is a home located in San Diego County with nearby schools including Tierra Bonita Elementary, Twin Peaks Middle, and Poway High.
Ownership History
Date
Name
Owned For
Owner Type
Purchase Details
Closed on
Jul 22, 2015
Sold by
Kall Janice E and Kall Janice B
Bought by
Kall Janice E
Current Estimated Value
Home Financials for this Owner
Home Financials are based on the most recent Mortgage that was taken out on this home.
Original Mortgage
$228,500
Outstanding Balance
$134,793
Interest Rate
3.98%
Mortgage Type
New Conventional
Estimated Equity
$817,240
Purchase Details
Closed on
Mar 18, 1994
Sold by
Johnson Nadine J
Bought by
Kall Janice E
Home Financials for this Owner
Home Financials are based on the most recent Mortgage that was taken out on this home.
Original Mortgage
$148,211
Interest Rate
7.79%
Mortgage Type
FHA
Purchase Details
Closed on
Feb 7, 1991
Purchase Details
Closed on
Sep 16, 1988
Purchase Details
Closed on
May 12, 1987
Create a Home Valuation Report for This Property
The Home Valuation Report is an in-depth analysis detailing your home's value as well as a comparison with similar homes in the area
Home Values in the Area
Average Home Value in this Area
Purchase History
| Date | Buyer | Sale Price | Title Company |
|---|---|---|---|
| Kall Janice E | -- | Placer Title Company | |
| Kall Janice E | $151,000 | Union Land Title Company | |
| -- | $150,500 | -- | |
| -- | $118,900 | -- | |
| -- | $71,700 | -- |
Source: Public Records
Mortgage History
| Date | Status | Borrower | Loan Amount |
|---|---|---|---|
| Open | Kall Janice E | $228,500 | |
| Closed | Kall Janice E | $148,211 |
Source: Public Records
Tax History Compared to Growth
Tax History
| Year | Tax Paid | Tax Assessment Tax Assessment Total Assessment is a certain percentage of the fair market value that is determined by local assessors to be the total taxable value of land and additions on the property. | Land | Improvement |
|---|---|---|---|---|
| 2025 | $2,843 | $256,621 | $205,305 | $51,316 |
| 2024 | $2,843 | $251,590 | $201,280 | $50,310 |
| 2023 | $2,782 | $246,658 | $197,334 | $49,324 |
| 2022 | $2,735 | $241,822 | $193,465 | $48,357 |
| 2021 | $2,699 | $237,081 | $189,672 | $47,409 |
| 2020 | $2,663 | $234,651 | $187,728 | $46,923 |
| 2019 | $2,594 | $230,051 | $184,048 | $46,003 |
| 2018 | $2,522 | $225,541 | $180,440 | $45,101 |
| 2017 | $173 | $221,119 | $176,902 | $44,217 |
| 2016 | $2,403 | $216,784 | $173,434 | $43,350 |
| 2015 | $2,368 | $213,528 | $170,829 | $42,699 |
| 2014 | $2,313 | $209,346 | $167,483 | $41,863 |
Source: Public Records
Map
Nearby Homes
- 44 Carlson Ct
- 45 Carlson Ct
- 43 Carlson Ct
- 0 Pebble Canyon Dr Unit PTP2505722
- 13765 Holly Oak Way
- 13770 Holly Oak Way
- 14963 Huntington Gate Dr Unit 2
- 14082 Pomegranate Ave Unit 146
- 13760 Holly Oak Way
- 13918 Putney Rd
- 0 Orchard View Dr Unit 250043559
- 14550 Dehia St
- 13654 Somerset Rd
- 13648 Putney Rd
- 13330 Canyon Back Ln
- 14152 Kendra Way
- 14513 Mirando St
- 14645 High Valley Rd
- 13409 Sutter Mill Rd
- 13255 Evanston Dr
- 14147 Ezra Ln
- 14157 Ezra Ln
- 14141 Ezra Ln
- 14135 Ezra Ln
- 14127 Ezra Ln
- 14119 Ezra Ln
- 14113 Ezra Ln
- 14107 Ezra Ln
- 14123 Ezra Ln
- 14101 Ezra Ln
- 14405 Tierra Bonita Rd
- 14305 Twin Peaks Rd
- 14061 Twin Peaks Rd
- 14233 Twin Peaks Rd
- 14265 Twin Peaks Rd
- 14149 Rio Ct
- 14141 Rio Ct
- * Vacant Land Poway
- 14321 Twin Peaks Rd
- 14133 Rio Ct