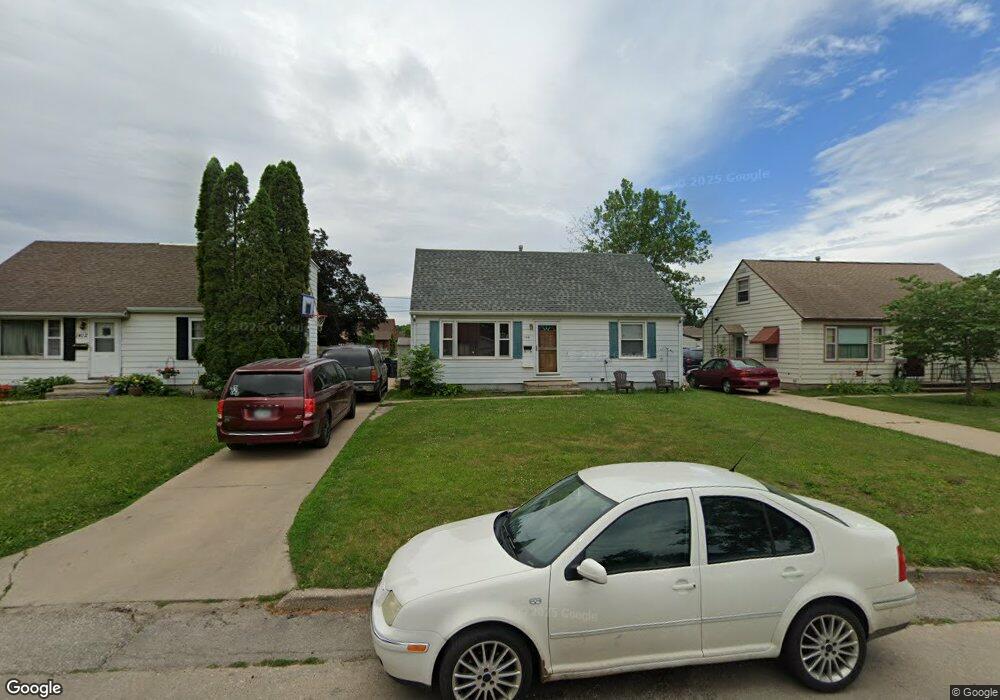
1416 10th St NW Cedar Rapids, IA 52405
Northwest Area NeighborhoodEstimated Value: $145,000 - $177,000
3
Beds
1
Bath
1,147
Sq Ft
$139/Sq Ft
Est. Value
About This Home
This home is located at 1416 10th St NW, Cedar Rapids, IA 52405 and is currently estimated at $159,961, approximately $139 per square foot. 1416 10th St NW is a home located in Linn County with nearby schools including Harrison Elementary School, Kentucky Tech - Ashland Reg Tech Center, and Ponderosa Elementary School.
Ownership History
Date
Name
Owned For
Owner Type
Purchase Details
Closed on
May 17, 2011
Sold by
Hsbc Mortgage Services Inc
Bought by
Sanderson Benjamin and Sanderson Michaela
Current Estimated Value
Purchase Details
Closed on
Mar 22, 2011
Sold by
Thomas Troy C and Thomas Jayne
Bought by
Hsbc Mortgage Services Inc
Purchase Details
Closed on
Jun 8, 2005
Sold by
Schipper Scott W and Schipper Melissa J
Bought by
Thomas Troy C and Thomas Jayne
Home Financials for this Owner
Home Financials are based on the most recent Mortgage that was taken out on this home.
Original Mortgage
$106,450
Interest Rate
7.49%
Mortgage Type
Fannie Mae Freddie Mac
Purchase Details
Closed on
Mar 30, 2000
Sold by
Phillips William G and Phillips Laura L
Bought by
Schipper Scott W and Schipper Melissa J
Home Financials for this Owner
Home Financials are based on the most recent Mortgage that was taken out on this home.
Original Mortgage
$90,508
Interest Rate
8.22%
Mortgage Type
FHA
Create a Home Valuation Report for This Property
The Home Valuation Report is an in-depth analysis detailing your home's value as well as a comparison with similar homes in the area
Home Values in the Area
Average Home Value in this Area
Purchase History
| Date | Buyer | Sale Price | Title Company |
|---|---|---|---|
| Sanderson Benjamin | $70,500 | None Available | |
| Hsbc Mortgage Services Inc | $81,257 | None Available | |
| Thomas Troy C | $106,000 | -- | |
| Schipper Scott W | $90,500 | -- |
Source: Public Records
Mortgage History
| Date | Status | Borrower | Loan Amount |
|---|---|---|---|
| Previous Owner | Thomas Troy C | $106,450 | |
| Previous Owner | Schipper Scott W | $90,508 |
Source: Public Records
Tax History Compared to Growth
Tax History
| Year | Tax Paid | Tax Assessment Tax Assessment Total Assessment is a certain percentage of the fair market value that is determined by local assessors to be the total taxable value of land and additions on the property. | Land | Improvement |
|---|---|---|---|---|
| 2025 | $2,282 | $141,900 | $30,900 | $111,000 |
| 2024 | $2,124 | $129,000 | $25,800 | $103,200 |
| 2023 | $2,124 | $129,000 | $25,800 | $103,200 |
| 2022 | $2,032 | $100,700 | $25,800 | $74,900 |
| 2021 | $2,244 | $98,100 | $23,200 | $74,900 |
| 2020 | $2,244 | $101,700 | $23,200 | $78,500 |
| 2019 | $2,064 | $95,800 | $20,600 | $75,200 |
| 2018 | $1,934 | $95,800 | $20,600 | $75,200 |
| 2017 | $1,908 | $92,000 | $20,600 | $71,400 |
| 2016 | $1,908 | $89,800 | $20,600 | $69,200 |
| 2015 | $1,906 | $88,295 | $20,604 | $67,691 |
| 2014 | $1,878 | $88,295 | $20,604 | $67,691 |
| 2013 | $1,838 | $88,295 | $20,604 | $67,691 |
Source: Public Records
Map
Nearby Homes
- 820 M Ave NW
- 1222 8th St NW
- 1238 Ellis Blvd NW
- 1130 13th St NW
- 1126 13th St NW
- 1424 N Ave NW
- 1016 H Ave NW
- 1015 Pawnee Dr NW
- 816 9th St NW
- 1624 O Ave NW
- 819 G Ave NW
- 1073 G Ave NW
- 716 F Ave NW
- 1871 Ellis Blvd NW Unit 202
- 1871 Ellis Blvd NW Unit 205
- 1724 O Ave NW
- 718 4th St NW
- 720 E Ave NW
- 714 East Ave NW
- 0 O Ave NW
- 1422 10th St NW
- 1412 10th St NW
- 1428 10th St NW
- 1006 M Ave NW
- 1010 M Ave NW
- 1419 11th St NW
- 1000 M Ave NW
- 1415 11th St NW
- 1423 11th St NW
- 1434 10th St NW
- 1016 M Ave NW
- 1431 11th St NW
- 1415 10th St NW
- 1022 M Ave NW
- 1411 10th St NW
- 1421 10th St NW
- 1401 10th St NW
- 1427 10th St NW
- 1504 10th St NW
- 1437 11th St NW