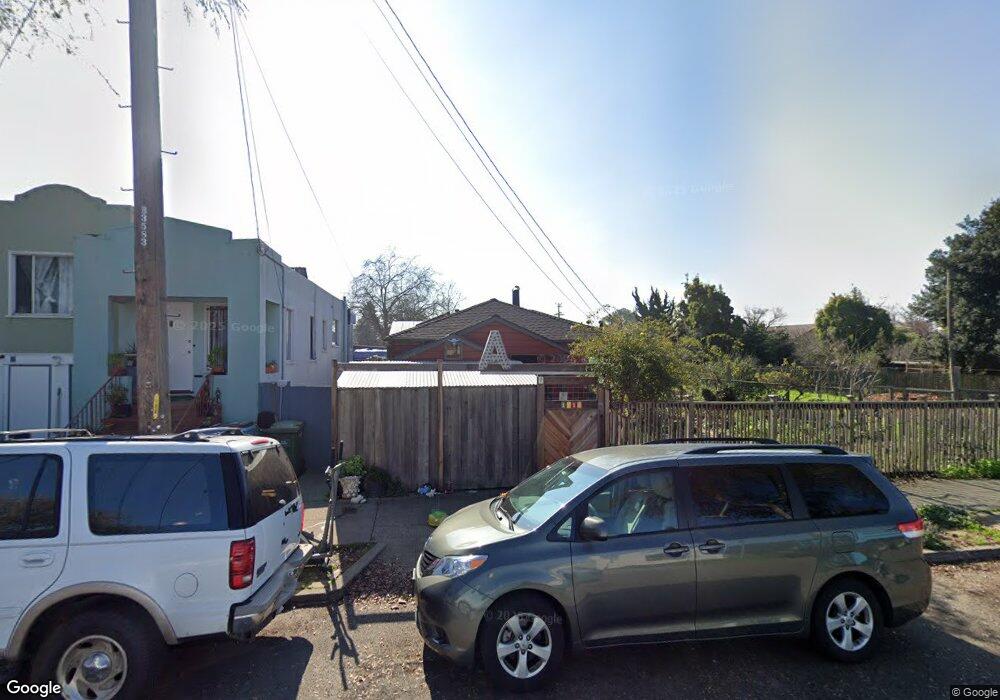
1416 Derby St Berkeley, CA 94702
West Berkeley NeighborhoodEstimated Value: $898,000 - $1,377,000
2
Beds
1
Bath
804
Sq Ft
$1,343/Sq Ft
Est. Value
About This Home
This home is located at 1416 Derby St, Berkeley, CA 94702 and is currently estimated at $1,079,853, approximately $1,343 per square foot. 1416 Derby St is a home located in Alameda County with nearby schools including Malcolm X Elementary School, Washington Elementary School, and Oxford Elementary School.
Ownership History
Date
Name
Owned For
Owner Type
Purchase Details
Closed on
Aug 16, 2021
Sold by
Agnew Jonathan
Bought by
Agnew Jonathan
Current Estimated Value
Home Financials for this Owner
Home Financials are based on the most recent Mortgage that was taken out on this home.
Original Mortgage
$200,000
Outstanding Balance
$176,795
Interest Rate
3.75%
Mortgage Type
Credit Line Revolving
Estimated Equity
$903,058
Purchase Details
Closed on
May 4, 2021
Sold by
Agnew Jonathan
Bought by
Agnew Jonathan
Home Financials for this Owner
Home Financials are based on the most recent Mortgage that was taken out on this home.
Original Mortgage
$548,250
Outstanding Balance
$491,773
Interest Rate
3%
Mortgage Type
New Conventional
Estimated Equity
$588,080
Purchase Details
Closed on
Jul 23, 2020
Sold by
Agnew Stephanie
Bought by
Agnew Jonathan
Purchase Details
Closed on
Oct 29, 2002
Sold by
Lindsay Louise and Kinchen Lucy Carolyn
Bought by
Agnew Jonathan and Agnew Stephanie
Home Financials for this Owner
Home Financials are based on the most recent Mortgage that was taken out on this home.
Original Mortgage
$245,600
Interest Rate
5.88%
Purchase Details
Closed on
Jun 8, 1999
Sold by
Lindsay Louise
Bought by
Lindsay Louise and Kinchen Lucy Carolyn
Create a Home Valuation Report for This Property
The Home Valuation Report is an in-depth analysis detailing your home's value as well as a comparison with similar homes in the area
Home Values in the Area
Average Home Value in this Area
Purchase History
| Date | Buyer | Sale Price | Title Company |
|---|---|---|---|
| Agnew Jonathan | -- | Placer Title Company | |
| Agnew Jonathan | -- | None Listed On Document | |
| Agnew Jonathan | -- | None Available | |
| Agnew Jonathan | $307,000 | Old Republic Title Company | |
| Kinchen Lucy Carolyn | -- | Old Republic Title Company | |
| Lindsay Louise | -- | -- |
Source: Public Records
Mortgage History
| Date | Status | Borrower | Loan Amount |
|---|---|---|---|
| Open | Agnew Jonathan | $200,000 | |
| Open | Agnew Jonathan | $548,250 | |
| Previous Owner | Agnew Jonathan | $245,600 | |
| Closed | Agnew Jonathan | $46,000 |
Source: Public Records
Tax History
| Year | Tax Paid | Tax Assessment Tax Assessment Total Assessment is a certain percentage of the fair market value that is determined by local assessors to be the total taxable value of land and additions on the property. | Land | Improvement |
|---|---|---|---|---|
| 2025 | $6,883 | $437,597 | $133,379 | $311,218 |
| 2024 | $6,883 | $428,881 | $130,764 | $305,117 |
| 2023 | $6,737 | $427,337 | $128,201 | $299,136 |
| 2022 | $6,614 | $411,958 | $125,687 | $293,271 |
| 2021 | $6,623 | $403,747 | $123,224 | $287,523 |
| 2020 | $6,281 | $406,538 | $121,961 | $284,577 |
| 2019 | $6,045 | $398,568 | $119,570 | $278,998 |
| 2018 | $5,941 | $390,755 | $117,226 | $273,529 |
| 2017 | $5,710 | $383,095 | $114,928 | $268,167 |
| 2016 | $5,528 | $375,586 | $112,676 | $262,910 |
| 2015 | $5,454 | $369,947 | $110,984 | $258,963 |
| 2014 | $5,418 | $362,701 | $108,810 | $253,891 |
Source: Public Records
Map
Nearby Homes
- 1450 Ward St
- 2750 Sacramento St
- 2758 Sacramento St
- 2774 Sacramento St
- 2782 Sacramento St
- 2790 Sacramento St
- 1515 Derby St
- 2717 Mabel St
- 1524 Blake St
- 1612 Parker St
- 2829 California St
- 2922 Stanton St
- 1604 Dwight Way
- 1535 Julia St
- 1634 Blake St
- 1135 Parker St
- 1142 Dwight Way
- 1144 Dwight Way
- 1314 Ashby Ave
- 1645 Dwight Way
Your Personal Tour Guide
Ask me questions while you tour the home.