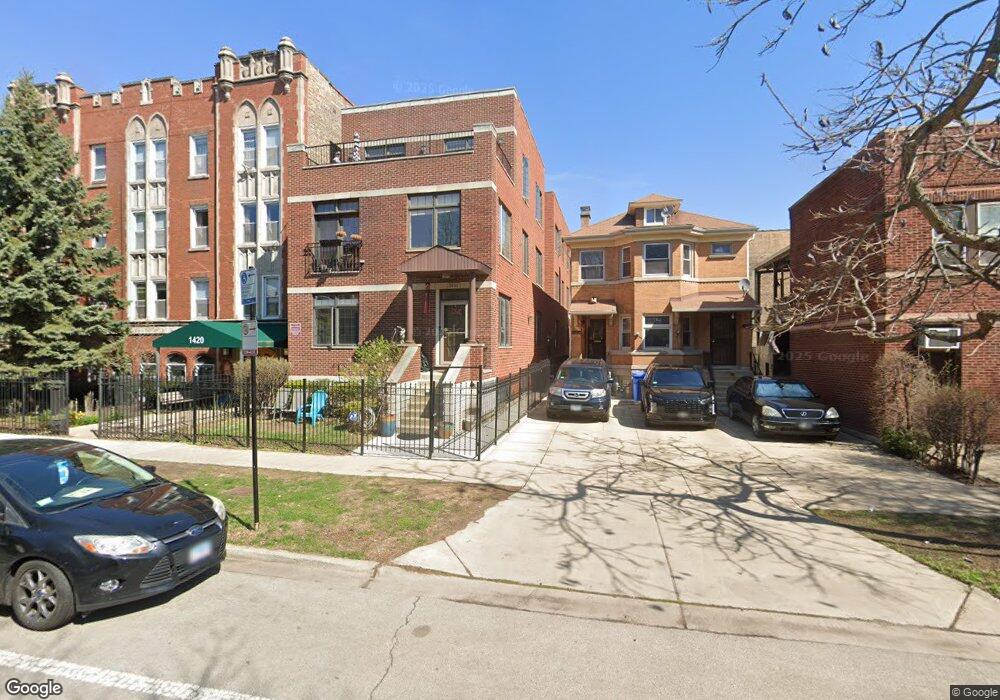
1416 W Farwell Ave Unit PENTHOU Chicago, IL 60626
Rogers Park NeighborhoodEstimated Value: $330,000 - $398,446
3
Beds
2
Baths
1,800
Sq Ft
$201/Sq Ft
Est. Value
About This Home
This home is located at 1416 W Farwell Ave Unit PENTHOU, Chicago, IL 60626 and is currently estimated at $362,149, approximately $201 per square foot. 1416 W Farwell Ave Unit PENTHOU is a home located in Cook County with nearby schools including New Field Elementary School, Eugene Field Elementary School, and Sullivan High School.
Ownership History
Date
Name
Owned For
Owner Type
Purchase Details
Closed on
Aug 26, 2013
Sold by
Han Enterprises Llc Series F
Bought by
Chapman H O and Chapman Catherine B
Current Estimated Value
Purchase Details
Closed on
Jul 20, 2011
Sold by
Harold Eisenberg Trust
Bought by
Han Enterprises Llc Series F
Purchase Details
Closed on
Dec 30, 2010
Sold by
Turik Alexander
Bought by
Harold Eisenberg Living Trust
Purchase Details
Closed on
Nov 24, 2010
Sold by
Jackson Vanessa
Bought by
Turik Alex
Purchase Details
Closed on
Sep 20, 2007
Sold by
1416 W Farwell Llc
Bought by
Jackson Vanessa
Home Financials for this Owner
Home Financials are based on the most recent Mortgage that was taken out on this home.
Original Mortgage
$417,000
Interest Rate
6.87%
Mortgage Type
New Conventional
Create a Home Valuation Report for This Property
The Home Valuation Report is an in-depth analysis detailing your home's value as well as a comparison with similar homes in the area
Home Values in the Area
Average Home Value in this Area
Purchase History
| Date | Buyer | Sale Price | Title Company |
|---|---|---|---|
| Chapman H O | $265,000 | Nat | |
| Han Enterprises Llc Series F | -- | None Available | |
| Harold Eisenberg Living Trust | -- | First American Title Insuran | |
| Turik Alex | $125,000 | Chicago Title Insurance Co | |
| Jackson Vanessa | $560,000 | Multiple |
Source: Public Records
Mortgage History
| Date | Status | Borrower | Loan Amount |
|---|---|---|---|
| Previous Owner | Jackson Vanessa | $417,000 |
Source: Public Records
Tax History Compared to Growth
Tax History
| Year | Tax Paid | Tax Assessment Tax Assessment Total Assessment is a certain percentage of the fair market value that is determined by local assessors to be the total taxable value of land and additions on the property. | Land | Improvement |
|---|---|---|---|---|
| 2024 | $4,153 | $38,110 | $2,788 | $35,322 |
| 2023 | $4,027 | $23,000 | $2,230 | $20,770 |
| 2022 | $4,027 | $23,000 | $2,230 | $20,770 |
| 2021 | $3,955 | $22,998 | $2,229 | $20,769 |
| 2020 | $3,391 | $18,325 | $1,796 | $16,529 |
| 2019 | $3,415 | $20,428 | $1,796 | $18,632 |
| 2018 | $3,357 | $20,428 | $1,796 | $18,632 |
| 2017 | $3,143 | $17,977 | $1,610 | $16,367 |
| 2016 | $3,100 | $17,977 | $1,610 | $16,367 |
| 2015 | $3,241 | $20,310 | $1,610 | $18,700 |
| 2014 | $3,952 | $23,868 | $1,486 | $22,382 |
| 2013 | $2,208 | $12,140 | $1,486 | $10,654 |
Source: Public Records
Map
Nearby Homes
- 1411 W Farwell Ave Unit E2
- 1415 W Lunt Ave Unit 207
- 1339 W Lunt Ave Unit 2N
- 1515 W Pratt Blvd Unit 1
- 6737 N Greenview Ave Unit 2S
- 6818 N Ashland Blvd Unit 1A
- 6809 N Lakewood Ave Unit 2N
- 1225 W Lunt Ave Unit 12252B
- 6712 N Glenwood Ave Unit 2
- 1634 W Morse Ave Unit C
- 1634 W Morse Ave Unit F
- 1211 W Morse Ave Unit 2
- 1643 W Farwell Ave Unit 3N
- 1238 W Pratt Blvd Unit 1A
- 1224 W Lunt Ave
- 1657 W Farwell Ave Unit 1D
- 1658 W Farwell Ave Unit GC
- 6648 N Newgard Ave Unit 2
- 1629 W Greenleaf Ave Unit 407
- 6711 N Lakewood Ave Unit 2N
- 1416 W Farwell Ave Unit 1R
- 1416 W Farwell Ave Unit 1F
- 1416 W Farwell Ave Unit 2R
- 1416 W Farwell Ave Unit 2F
- 1416 W Farwell Ave Unit PH
- 1412 W Farwell Ave
- 1408 W Farwell Ave
- 1426 Farwell Ave W Unit 2
- 1426 Farwell Ave W Unit 1
- 1426 Farwell Ave W Unit 3N
- 1422 W Farwell Ave
- 1422 W Farwell Ave Unit 3N
- 1417 W Farwell Ave Unit 1417
- 1417 W Farwell Ave Unit G
- 1417 W Farwell Ave Unit 1
- 1417 W Farwell Ave Unit 204
- 1417 W Farwell Ave Unit 109
- 1417 W Farwell Ave Unit 208
- 1417 W Farwell Ave Unit 206
- 1417 W Farwell Ave