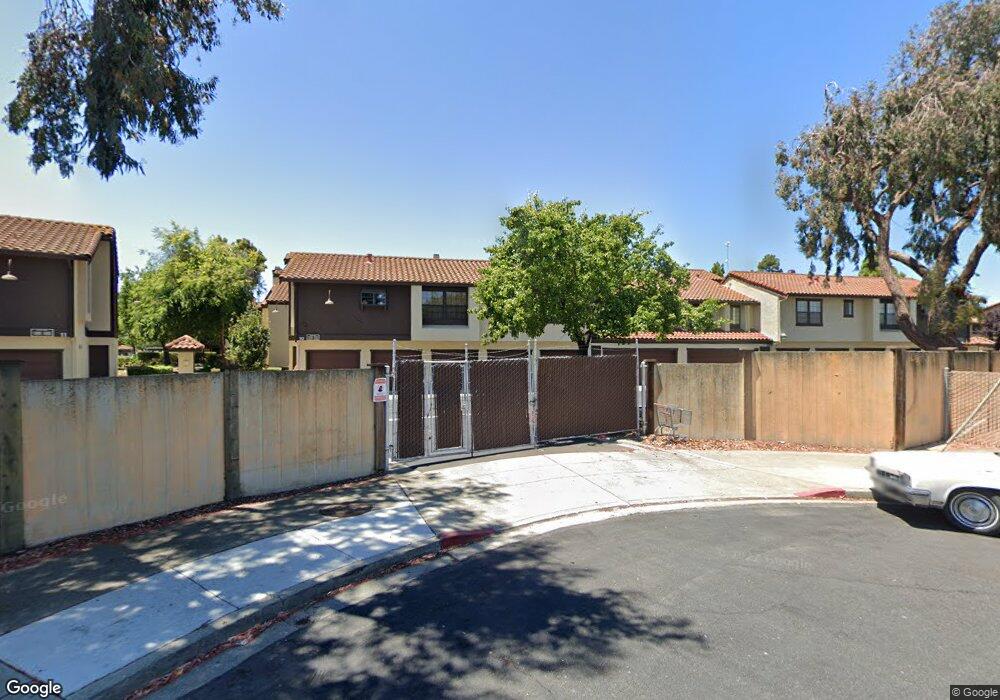
14165 Seagate Dr Unit 226 San Leandro, CA 94577
Marina Faire NeighborhoodEstimated Value: $702,000 - $732,000
3
Beds
2
Baths
1,596
Sq Ft
$449/Sq Ft
Est. Value
About This Home
This home is located at 14165 Seagate Dr Unit 226, San Leandro, CA 94577 and is currently estimated at $716,217, approximately $448 per square foot. 14165 Seagate Dr Unit 226 is a home located in Alameda County with nearby schools including Garfield Elementary School, John Muir Middle School, and San Leandro High School.
Ownership History
Date
Name
Owned For
Owner Type
Purchase Details
Closed on
Mar 4, 2020
Sold by
Shen Jun
Bought by
Magpoc Joven C and Magpoc Laarni R
Current Estimated Value
Home Financials for this Owner
Home Financials are based on the most recent Mortgage that was taken out on this home.
Original Mortgage
$617,500
Outstanding Balance
$546,884
Interest Rate
3.5%
Mortgage Type
New Conventional
Estimated Equity
$169,333
Purchase Details
Closed on
May 29, 2015
Sold by
Shen Jun and Li Jianjun
Bought by
Shen Jun
Purchase Details
Closed on
Mar 5, 2012
Sold by
Singh Sharon
Bought by
Shen Jun and Li Jianjun
Purchase Details
Closed on
Apr 29, 1998
Sold by
Pisanu Antonio N and Pisanu Anna R
Bought by
Singh Sharon
Home Financials for this Owner
Home Financials are based on the most recent Mortgage that was taken out on this home.
Original Mortgage
$153,000
Interest Rate
9.35%
Mortgage Type
Purchase Money Mortgage
Create a Home Valuation Report for This Property
The Home Valuation Report is an in-depth analysis detailing your home's value as well as a comparison with similar homes in the area
Home Values in the Area
Average Home Value in this Area
Purchase History
| Date | Buyer | Sale Price | Title Company |
|---|---|---|---|
| Magpoc Joven C | $650,000 | Fidelity National Title | |
| Shen Jun | -- | None Available | |
| Shen Jun | $241,000 | Chicago Title Company | |
| Singh Sharon | $180,000 | North American Title Co |
Source: Public Records
Mortgage History
| Date | Status | Borrower | Loan Amount |
|---|---|---|---|
| Open | Magpoc Joven C | $617,500 | |
| Previous Owner | Singh Sharon | $153,000 |
Source: Public Records
Tax History Compared to Growth
Tax History
| Year | Tax Paid | Tax Assessment Tax Assessment Total Assessment is a certain percentage of the fair market value that is determined by local assessors to be the total taxable value of land and additions on the property. | Land | Improvement |
|---|---|---|---|---|
| 2025 | $9,374 | $703,858 | $213,257 | $497,601 |
| 2024 | $9,374 | $689,923 | $209,077 | $487,846 |
| 2023 | $9,310 | $683,260 | $204,978 | $478,282 |
| 2022 | $9,050 | $662,863 | $200,959 | $468,904 |
| 2021 | $8,770 | $649,733 | $197,020 | $459,713 |
| 2020 | $5,409 | $385,647 | $115,694 | $269,953 |
| 2019 | $5,255 | $378,088 | $113,426 | $264,662 |
| 2018 | $5,111 | $370,677 | $111,203 | $259,474 |
| 2017 | $5,027 | $363,408 | $109,022 | $254,386 |
| 2016 | $4,771 | $356,284 | $106,885 | $249,399 |
| 2015 | $3,468 | $251,868 | $75,560 | $176,308 |
| 2014 | $3,435 | $246,935 | $74,080 | $172,855 |
Source: Public Records
Map
Nearby Homes
- 14161 Seagate Dr Unit 228
- 2515 Galleon Place Unit 129
- 2474 Fairway Dr
- 14512 Trinidad Rd
- 2444 Belvedere Ave
- 2262 Bermuda Ave
- 14075 Doolittle Dr
- 2350 W Avenue 135th
- 14587 Doolittle Dr
- 14617 Doolittle Dr
- 2127 Fairway Dr
- 2140 W Avenue 134th
- 2090 Marina Blvd
- 2078 Fairbanks St
- 1947 Nome St
- 2258 Sitka St
- 1803 Cedar Ave
- 1875 Willow Ave
- 14466 Acacia St
- 509 Santa Ynez
- 14217 Seagate Dr
- 14169 Seagate Dr
- 14163 Seagate Dr Unit 227
- 14215 Seagate Dr
- 14161 Seagate Dr Unit COND
- 14173 Seagate Dr
- 14171 Seagate Dr
- 14179 Seagate Dr Unit 219
- 14177 Seagate Dr
- 14167 Seagate Dr
- 14211 Seagate Dr
- 14203 Seagate Dr
- 14213 Seagate Dr
- 14178 Outrigger Dr
- 14209 Seagate Dr
- 14183 Seagate Dr
- 14164 Outrigger Dr
- 14230 Outrigger Dr
- 14180 Outrigger Dr Unit 27
- 2503 Bermuda Ave