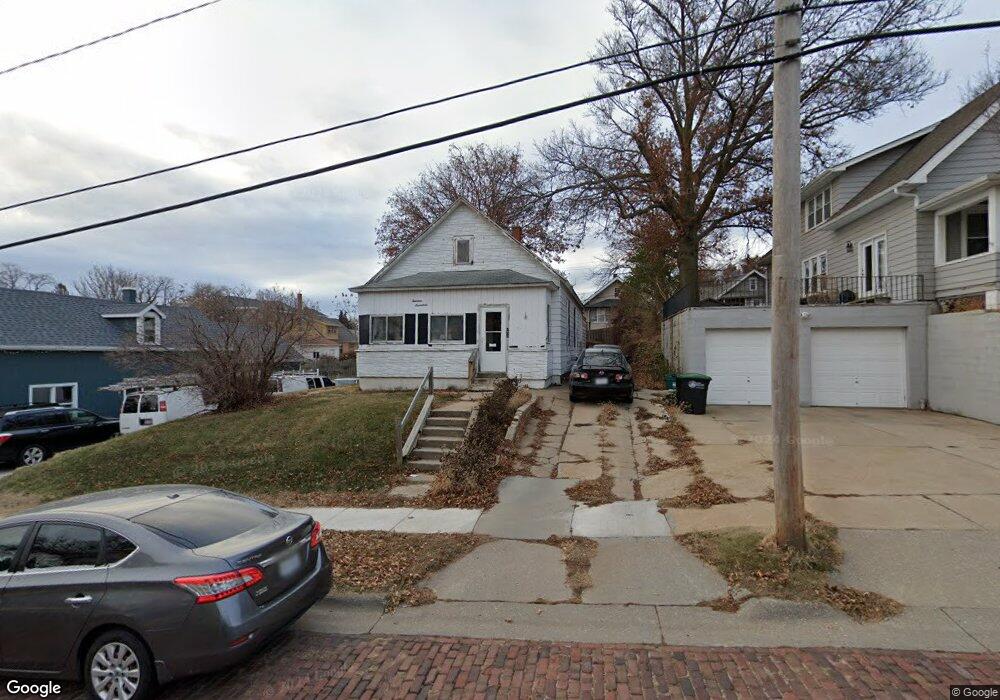
1417 B St Omaha, NE 68108
South Central Omaha NeighborhoodEstimated Value: $138,000 - $173,000
3
Beds
3
Baths
1,356
Sq Ft
$111/Sq Ft
Est. Value
About This Home
This home is located at 1417 B St, Omaha, NE 68108 and is currently estimated at $150,662, approximately $111 per square foot. 1417 B St is a home located in Douglas County with nearby schools including Spring Lake Magnet Center, R.M. Marrs Magnet Middle School, and South High Magnet School.
Ownership History
Date
Name
Owned For
Owner Type
Purchase Details
Closed on
Nov 5, 2010
Sold by
Hamilton Patricia A and Hamilton Larry C
Bought by
York Jeffrey M
Current Estimated Value
Home Financials for this Owner
Home Financials are based on the most recent Mortgage that was taken out on this home.
Original Mortgage
$73,098
Outstanding Balance
$48,360
Interest Rate
4.4%
Mortgage Type
FHA
Estimated Equity
$102,302
Purchase Details
Closed on
Apr 24, 2007
Sold by
Mengler Richard J
Bought by
Hamilton Larry C
Create a Home Valuation Report for This Property
The Home Valuation Report is an in-depth analysis detailing your home's value as well as a comparison with similar homes in the area
Home Values in the Area
Average Home Value in this Area
Purchase History
| Date | Buyer | Sale Price | Title Company |
|---|---|---|---|
| York Jeffrey M | $38,000 | Ch | |
| York Jeffrey M | $38,000 | Ch | |
| Hamilton Larry C | $43,000 | -- |
Source: Public Records
Mortgage History
| Date | Status | Borrower | Loan Amount |
|---|---|---|---|
| Open | York Jeffrey M | $73,098 |
Source: Public Records
Tax History
| Year | Tax Paid | Tax Assessment Tax Assessment Total Assessment is a certain percentage of the fair market value that is determined by local assessors to be the total taxable value of land and additions on the property. | Land | Improvement |
|---|---|---|---|---|
| 2025 | $1,470 | $89,300 | $14,700 | $74,600 |
| 2024 | $1,698 | $89,300 | $14,700 | $74,600 |
| 2023 | $1,698 | $80,500 | $14,700 | $65,800 |
| 2022 | $1,586 | $74,300 | $8,500 | $65,800 |
| 2021 | $1,556 | $73,500 | $8,500 | $65,000 |
| 2020 | $1,574 | $73,500 | $8,500 | $65,000 |
| 2019 | $1,306 | $60,800 | $8,500 | $52,300 |
| 2018 | $1,198 | $55,700 | $8,500 | $47,200 |
| 2017 | $1,031 | $47,700 | $4,400 | $43,300 |
| 2016 | $1,024 | $47,700 | $4,400 | $43,300 |
Source: Public Records
Map
Nearby Homes
Your Personal Tour Guide
Ask me questions while you tour the home.