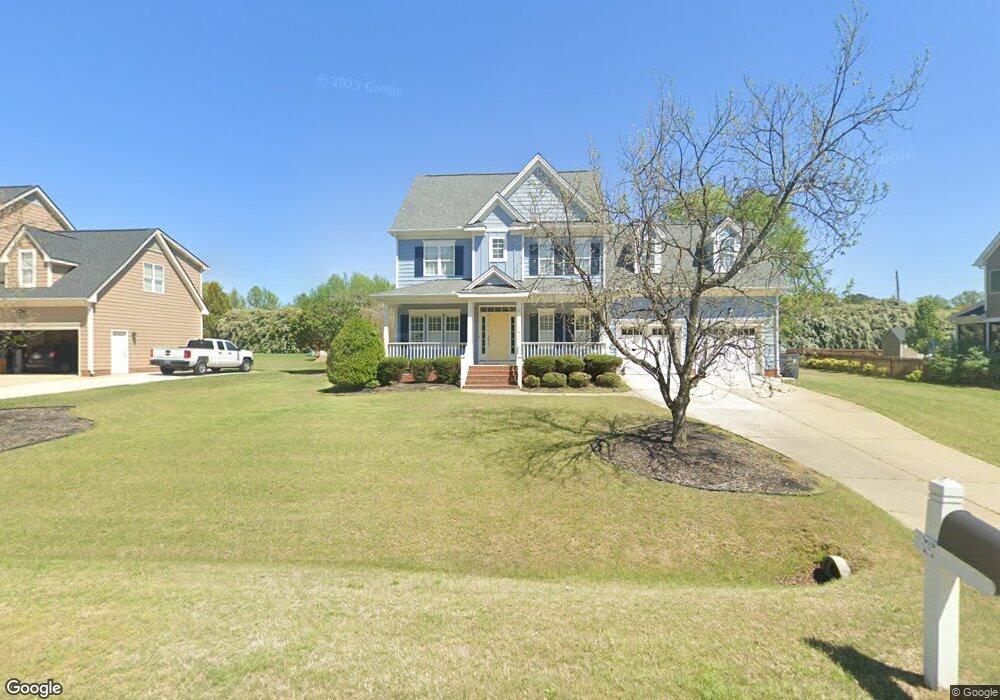
1417 Upchurch Woods Dr Unit LOT62 Raleigh, NC 27603
Estimated Value: $448,000 - $527,000
3
Beds
3
Baths
2,147
Sq Ft
$224/Sq Ft
Est. Value
About This Home
This home is located at 1417 Upchurch Woods Dr Unit LOT62, Raleigh, NC 27603 and is currently estimated at $480,609, approximately $223 per square foot. 1417 Upchurch Woods Dr Unit LOT62 is a home located in Wake County with nearby schools including North Garner Middle and South Garner High.
Ownership History
Date
Name
Owned For
Owner Type
Purchase Details
Closed on
Sep 1, 2017
Sold by
Laughridge Palmer Girffin and Laughridge Elizebeth Broughton
Bought by
Peterson Jacob I and Peterson Samantha J
Current Estimated Value
Home Financials for this Owner
Home Financials are based on the most recent Mortgage that was taken out on this home.
Original Mortgage
$280,900
Outstanding Balance
$234,949
Interest Rate
3.96%
Mortgage Type
VA
Estimated Equity
$245,660
Purchase Details
Closed on
Nov 25, 2009
Sold by
Dixie Construction Company Inc Of Raleig
Bought by
Laughridge Palmer Griffin and Laughridge Elizabeth Broughton
Home Financials for this Owner
Home Financials are based on the most recent Mortgage that was taken out on this home.
Original Mortgage
$205,000
Interest Rate
4.94%
Mortgage Type
New Conventional
Purchase Details
Closed on
Feb 2, 2006
Sold by
Upchurch Land Co Llc
Bought by
Dixie Construction Co Inc Of Raleigh
Create a Home Valuation Report for This Property
The Home Valuation Report is an in-depth analysis detailing your home's value as well as a comparison with similar homes in the area
Home Values in the Area
Average Home Value in this Area
Purchase History
| Date | Buyer | Sale Price | Title Company |
|---|---|---|---|
| Peterson Jacob I | $275,000 | None Available | |
| Laughridge Palmer Griffin | $245,000 | Chicago Title Insurance Co | |
| Dixie Construction Co Inc Of Raleigh | $712,500 | None Available |
Source: Public Records
Mortgage History
| Date | Status | Borrower | Loan Amount |
|---|---|---|---|
| Open | Peterson Jacob I | $280,900 | |
| Previous Owner | Laughridge Palmer Griffin | $205,000 |
Source: Public Records
Tax History Compared to Growth
Tax History
| Year | Tax Paid | Tax Assessment Tax Assessment Total Assessment is a certain percentage of the fair market value that is determined by local assessors to be the total taxable value of land and additions on the property. | Land | Improvement |
|---|---|---|---|---|
| 2025 | $2,867 | $445,160 | $85,000 | $360,160 |
| 2024 | $2,784 | $445,160 | $85,000 | $360,160 |
| 2023 | $2,276 | $289,321 | $38,000 | $251,321 |
| 2022 | $2,109 | $289,321 | $38,000 | $251,321 |
| 2021 | $2,053 | $289,321 | $38,000 | $251,321 |
| 2020 | $2,019 | $289,321 | $38,000 | $251,321 |
| 2019 | $2,077 | $251,812 | $40,000 | $211,812 |
| 2018 | $1,910 | $251,812 | $40,000 | $211,812 |
| 2017 | $1,810 | $251,812 | $40,000 | $211,812 |
| 2016 | $1,774 | $251,812 | $40,000 | $211,812 |
| 2015 | $1,761 | $250,665 | $40,000 | $210,665 |
| 2014 | $1,669 | $250,665 | $40,000 | $210,665 |
Source: Public Records
Map
Nearby Homes
- 1559 Upchurch Woods Dr
- 1004 Snow Peak Ct
- 6109 Oak Passage Dr
- 6009 Swales Way
- 9017 Hunterfox Ct
- 6257 Oak Passage Dr
- 10001 Joe Leach Rd
- 6121 Catandpolly Ln
- 1101 Robinfield Dr
- 6408 Glen Brack Ct
- 5521 Fantasy Moth Dr
- 5013 Contender Dr
- 6313 Southern Charm Ln
- 9505 Neils Branch Rd
- 1021 Wintu Ct
- 920 Shadywood Ln
- 1004 Cabin Hill Way
- 170 Sallyport Ct
- 1009 Feldmen Dr
- 408 Johnston Rd
- 1417 Upchurch Woods Dr
- 1421 Upchurch Woods Dr Unit 63
- 1421 Upchurch Woods Dr
- 1413 Upchurch Woods Dr
- 1413 Upchurch Woods Dr Unit LOT61
- 1421 Upchurch Wood Dr
- 1409 Upchurch Wood Dr
- 1409 Upchurch Woods Dr Unit LOT60
- 1409 Upchurch Woods Dr
- 1501 Upchurch Woods Dr
- Lot 4 Jordan Rd
- Lot 1 Jordan Rd
- Lot 3 Jordan Rd
- Lot 2 Jordan Rd
- 10800 Jordan Rd
- 0 Jordan Rd Unit N TR1652353
- 0 Jordan Rd Unit N TR1720552
- 0 Jordan Rd Unit TR1837232
- 0 Jordan Rd Unit N 1652353
- 0 Jordan Rd Unit N 1720552